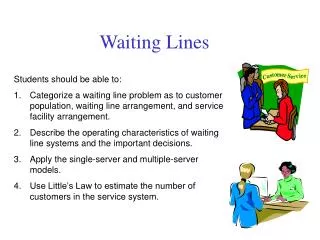
Managing Waiting Lines
Managing Waiting Lines. Lines and Waiting. “Every day I get in the queue, that waits for the bus that takes me to you …” Pete Townshend, Magic Bus. Where the Time Goes. In a life time, the average American will spend-- SIX MONTHS


Managing Waiting Lines
E N D
Presentation Transcript
Lines and Waiting “Every day I get in the queue, that waits for the bus that takes me to you …” Pete Townshend, Magic Bus
Where the Time Goes In a life time, the average American will spend-- SIX MONTHS Waiting at stoplights EIGHT MONTHS Opening junk mail ONE YEAR Looking for misplaced 0bjects Unsuccessfully returning TWO YEARS phone calls FOUR YEARS Doing housework FIVE YEARS Waiting in line SIX YEARS Eating
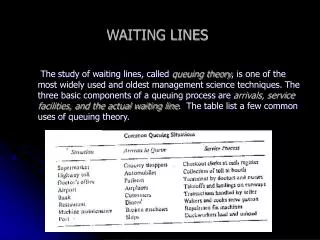
Cultural Attitudes • “Americans hate to wait. So business is trying a trick or two to make lines seem shorter…” The New York Times, September 25, 1988 • “An Englishman, even when he is by himself, will form an orderly queue of one…” George Mikes, “How to be an Alien” • “In the Soviet Union, waiting lines were used as a rationing device…” Hedrick Smith, “The Russians”
Waiting Realities • Inevitability of Waiting:Waiting results from variations in arrival rates and service rates • Economics of Waiting: High utilization purchased at the price of customer waiting. Make waiting productive (salad bar) or profitable (drinking bar).
Laws of Service • Maister’s First Law:Customers compare expectations with perceptions. • Maister’s Second Law:Is hard to play catch-up ball. • Skinner’s Law:The other line always moves faster. • Jenkin’s Corollary:However, when you switch to another other line, the line you left moves faster.
Remember Me • I am the person who goes into a restaurant, sits down, and patiently waits while the wait-staff does everything but take my order. • I am the person that waits in line for the clerk to finish chatting with his buddy. • I am the one who never comes back and it amuses me to see money spent to get me back. • I was there in the first place, all you had to do was show me some courtesy and service.The Customer
Psychology of Waiting • That Old Empty Feeling: Unoccupied time goes slowly • A Foot in the Door: Pre-service waits seem longer that in-service waits • The Light at the End of the Tunnel: Reduce anxiety with attention • Excuse Me, But I Was First: Social justice with FCFS queue discipline • They Also Serve, Who Sit and Wait:Avoids idle service capacity
Approaches to Controlling Customer Waiting • Animate: Disneyland distractions, elevator mirror, recorded music • Discriminate: Avis frequent renter treatment (out of sight) • Automate: Use computer scripts to address 75% of questions • Obfuscate: Disneyland staged waits (e.g. House of Horrors)
The Art of Service Recovery“To err is human; to recover, divine” • Measure Cost of Lost Customer • Listen Carefully • Anticipate Need for Recovery • Act Fast • Train Employees • Empower the Frontline • Inform Customers of Improvement
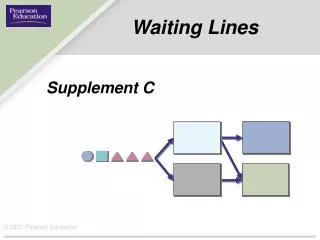
Essential Features of Queuing Systems Renege Arrival process Queue discipline Departure Calling population Service process Queue configuration No future need for service Balk
Arrival Process Arrival process Static Dynamic Random arrivals with constant rate Random arrival rate varying with time Facility- controlled Customer- exercised control Accept/Reject Price Appointments Reneging Balking
Poisson and Exponential Equivalence Poisson distribution for number of arrivals per hour (top view) One-hour 1 2 0 1 interval Arrival Arrivals Arrivals Arrival 62 min. 40 min. 123 min. Exponential distribution of time between arrivals in minutes (bottom view)
Queue Configurations Multiple Queue Single queue Take a Number Enter 3 4 2 8 6 10 12 7 11 9 5
Queue Discipline Queue discipline Static (FCFS rule) Dynamic selection based on status of queue Selection based on individual customer attributes Number of customers waiting Round robin Priority Preemptive Processing time of customers (SPT rule)
Service Facility Arrangements Service facility Server arrangement Parking lot Self-serve Cafeteria Servers in series Toll booths Servers in parallel Supermarket Self-serve, first stage; parallel servers, second stage Hospital Many service centers in parallel and series, not all used by each patient
Topics for Discussion • Suggest some strategies for controlling variability in service times. • Suggest diversions that could make waiting less painful. • Select a bad and good waiting experience, and contrast the situations with respect to the aesthetics of the surroundings, diversions, people waiting, and attitude of servers. • Suggest ways that management can influence the arrival times of customers. • What are the benefits of a fast-food employee taking your order while waiting in line?
Interactive Exercise The class breaks into small groups with at least one international student in each group, if possible. Based on overseas travel, each group reports on observations of waiting behavior from a cultural perspective.
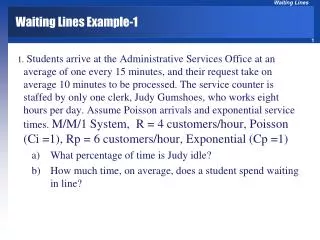
Pronto Pizza • Draw a process flow diagram and identify the bottleneck operation. • Calculate the expected waiting time in the order preparation queue. Compare this value with your simulation result. • Use the ServiceModel computer simulation software and the Pronto.pkg file to determine the number of drivers that minimizes the total cost of salaries and guarantee discounts.
Pronto Pizza (cont.) • Based on your simulation recommended staffing level, what is the probability of paying off on the guarantee? • What do you think of this service guarantee policy? • What other design or operating suggestions could improve Pronto Pizza’s performance and customer service?