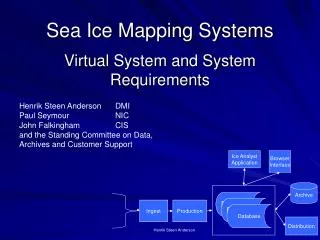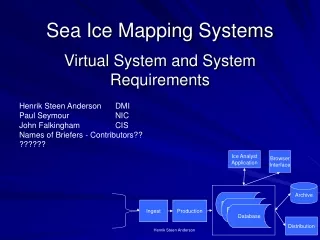
Charting and Mapping the Land-Sea Interface
310 likes | 547 Vues
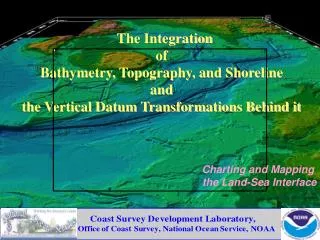
The Integration of Bathymetry, Topography, and Shoreline and the Vertical Datum Transformations Behind it. Charting and Mapping the Land-Sea Interface. Some Problems with Charting and Mapping the U.S. Coastal Zone “95,000 miles of Coastline !”. Outdated data ( and low resolution)

Charting and Mapping the Land-Sea Interface
E N D
Presentation Transcript
The Integration of Bathymetry, Topography, and Shorelineand the Vertical Datum Transformations Behind it Charting and Mapping the Land-Sea Interface
Some Problems with Charting and Mapping the U.S. Coastal Zone“95,000 miles of Coastline !” Outdated data ( and low resolution) - bathymetry (NOS) [outside the navigation channels] - topography (USGS) NOAA and USGS products do not match [especially the shoreline] Difficulty measuring a consistently definedshoreline Limited resources for new data (95,000 miles!) Incompatibility between data sets from local sources (e.g., federal, state, county, city) A geospatial reference frame for other coastal data sets that is less consistent and accurate than is needed Affecting a variety of coastalapplications (in addition to navigation products): -- hurricane evacuation planning -- permitting -- local, state, and national boundaries -- habitat restoration -- shoreline change analysis -- assessing and determining setback lines -- erosion, accretion, renourishment -- natural hazards
Applications for Integrated Bathymetric/Topographic/Shoreline • Hurricane evacuation planning • Permitting • Assessing and determining setback lines • Determining local, state, and national boundaries • Habitat restoration • Erosion, accretion, nourishment • Shoreline Change Analysis • Analyzing storm impacts • Analyzing environmental and natural resources • Emergency Response and Impact Assessment • Navigation Products and Services Florida Marine Spill Analysis System Habitat Assessment
Inconsistent Shorelines Inconsistency between shorelines on NOAA and USGS products NOAA Shoreline plotted on a USGS Topo Sheet
“the beginning”The Tampa Bay Bathymetric/Topographic Demonstration Project Partners: NOS: OCS, NGS, CSC, CO-OPS USGS: NMD (incl. EROS Data Ctr) Others: UNH, FMRI, users Mapping the Land-Sea Interface
NOS Bathymetric Data Except for in and around the navigation channels, the bathymetric data are from the 1950s. NOS needs to be able to take advantage of other data sources. This is typical all around the country. In the nearshore areas the data are old.
USGS Topographic Data The original topographic data for the Tampa Bay area are also primarily from the 1950s, with some 1960s and early 1970s data. This is also typical all around the country. In many areas the topographic data are old.
NOS Shoreline Data High-Resolution Up-to-Date Shoreline from various Airborne and Satellite Techniques in Tampa Bay (NGS/RSD) For some areas the shoreline data are much more recent, but shoreline measurement has its own special problems. In addition to the April 1999 airborne photogrammetry and the SPIN2 satellite data, shoreline data sets will be derived (and inter-compared) from: airborne lidar data, airborne hyperspectral data, IKONOS satellite data, SAR data, and SHOALS (bathymetric lidar) data.
A Different Problem with Shoreline Keeping up with changes in Manmade Shoreline Nautical Chart 1977 Photogrammetry 1998 Image from Spin2 1999 Photogrammetry Satellite images can help spot the changes, but is the resolution good enough for all purposes?
How to cost-effectively map 95,000 miles of U.S. coastline? NOS alone can’t acquire all the new bathymetry needed, and NOS will always have to give priority to navigational channels in ports. Thus, NOS needs to be able to take advantage of other good quality data sources. (“3rd-Party Data”) [as does USGS also] What prevents NOS from using “3rd-Party Data” ? - standards - commonverticaldatums
All Bathymetric and Topographic Elevation Data is georeferenced to a Vertical DatumDatums Arise From Relative Measurements, I 25 20 15 10.0 10 5.0 5.0 5 0.0 0 Datum A
All Bathymetric and Topographic Elevation Data is georeferenced to a Vertical DatumDatums Arise From Relative Measurements, II 20 15 10.0 10 5.0 5 0.0 0.0 0 -5 -10 Datum B
All Bathymetric and Topographic ElevationData is georeferenced to a Vertical DatumDatums Arise From Relative Measurements, III 20 25 15 10.0 20 10 5.0 15 5 0.0 0.0 10.0 10 0 5.0 5.0 -5 5 0.0 -10 0 Datum A Datum B Discontinuity between A & B
When Datums Match 25 20.0 20 15.0 15 10.0 10.0 10.0 10 5.0 5.0 5 0.0 0 Datum A (All elevations are now consistent)
USGS Topography Integrated Bathy/Topo Model NOAA Bathymetry
Validating the datum transformation with new GPS-referenced bathymetric data Slice through historical bathymetric data that was transformed to the ellipsoid (red curve) compared with January 2000 transect referenced to the ellipsoid (blue curve).
Airborne Lidar Mapping Cover intertidal zone Fly topographic LIDAR near Low Water. MLLW MHW Fly Water-penetrating bathymetric LIDAR near High Water, e.g. SHOALS. Light Detection and Ranging (LIDAR)
ATM LIDAR USGS DOQ Lidar in and landward of the intertidal zone - transformation of Lidar DEM to MHW datum to produce MHW shoreline using VDatum (with tidal datums from hydrodynamic model). - for the zone where the transformed topographic data meets the transformed bathymetric data Univ. of FL LIDAR
MHW Shoreline Produced from LIDAR 16,000 points T-Sheet MHW shoreline 1m GRID T-Sheet (1977) NOAA Chart 11417 1:80,000 MHW (LIDAR)(1996) Tampa Bay = 40m LIDAR data from the University of Florida transformed to the MHW datum using VDatum.
MHW Shoreline Produced from LIDAR LIDAR data from the University of Florida transformed to the MHW datum using VDatum. NOAA T-Sheet MHW shoreline (1977) Old Tampa Bay 0 m contour is MHW shoreline (1996) 1m GRID
MHW Shoreline from LIDAR superimposed on 1m DOQQ Old Tampa Bay NOAA T-Sheet (1977) 0 m contour (MHW) 1996 Mangroves MHW Time of DOQQ
Lidar data from CSC/USGS/NASA Central California
NASA ATM II 1m LIDAR DEM Central California (just south of entrance to San Francisco) NAVD88 heights (meters) LIDAR data from CSC / USGS / NASA
Tidal Datum Fields off the Coast of California Higher High Water High Water Low Water Lower Low Water MHW • MHW tidal datum fields (as well as MHHW, MLW, MLLW, MSL, MTL, DTL) from calibrated hydrodynamic models • Analysis of model-produced time series, then adjusted to provide a best fit to datums at NOS gauges.
MHW From 1m LIDAR superimposed on Nautical Chart Entrance to San Francisco Bay MHW shoreline on NOAA nautical chart 18649 MHW shoreline from 1m LIDAR Bluffs Central California Bathy Project LIDAR data from CSC / USGS / NASA
Tidal Model Integrated Bathy/Topo Digital Elevation Model USGS Topography Geoid Model Ellipsoid Model National VDatum (Vertical Datum Transform Tool) National Bathymetric Database NOAA Bathymetry Shoreline from LIDAR in the intertidal zone NOAA-USGS shoreline inconsistencies RTK-GPS vertical referencing Hydrographic Surveys GIS users in the Coastal Community Marine Boundaries & Legal Issues • User-friendly utilization of DEM with new hi-res data in a GIS environment State owned Privately owned USGS Topo Sheet NOAA Shoreline LIDAR