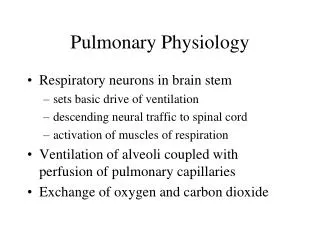
Pulmonary Function Testing Clinical Physiology
Pulmonary Function Testing Clinical Physiology . Peter Krumpe, MD VA Sierra Nevada Health Care System Professor Emeritus, UNRSOM. Dr Hutchenson. Spirometry: Objectives.

Pulmonary Function Testing Clinical Physiology
E N D
Presentation Transcript
Pulmonary Function Testing Clinical Physiology Peter Krumpe, MD VA Sierra Nevada Health Care System Professor Emeritus, UNRSOM
Spirometry: Objectives • Draw a normal spirogram, labeling the four lung volumes and four capacities. List the volumes that comprise each of the four capacities. Identify which volume and capacities cannot be measured by spirometry. • Define the factors that determine total lung capacity, functional residual capacity and residual volume. Describe the mechanisms responsible for the changes in those volumes that occur in patients with emphysema and pulmonary fibrosis. • http://www.the-aps.org/education/MedPhysObj/pulm.htm
Subdivisions of lung Volumes • Volumes: RV, ERV, Vt, IRV... spirometry • Capacities: RV+ERV+Vt+IRV = TLC • RV + ERV = FRC (end tidal resting volume) • ERV + Vt + IRV = VC • Vt + IRV = IC • FRC + IC = TLC • Ratios: RV / TLC = 30% normally… up t0 38% at old age.
Measurement of FRC • Helium dilution • C1 V1 = C2 (V1 + V2) • V1 is volume of spirometer • C1 is initial [He], C2 is [He] after equilibration • V2 is FRC… solve for V2
Determining RV • Measure FRC by He dilution • Measure IC from spirometer tracing • FRC + IC = TLC • Measure VC from spirometer tracing • RV = TLC - VC • Correct data to BTPS • Express as percent predicted value
PFTs- Normal Values • Groups if “normal” subjects have data recorded • Stratified by: Gender, height, Race • Values expressed as regressions of data vs age • Values +/- 2 SD = “normal”… 95% of normals • Normal values +/- 20% are typical (IE 80% to 120% predicted)
Office Spirometry Objectives • Draw a spirogram resulting from a maximal expiratory effort. Label the forced vital capacity (FVC), timed forced expiratory volumes (FEV1). • Draw a normal maximal effort flow-volume curve, labeling the effort-dependent and -independent regions. Use the concept of dynamic compression of airways to explain why each point in the effort-independent region of the curve represents a maximal flow rate that is uniquely dependent on lung volume. Describe how and why the shape of the flow-volume curve is shifted in chronic obstructive lung disease (COPD).
Forced Vital Capacity Maneuver • POOF! (effort, learning curve, motivation) • Maximum expiration from TLC to RV for > 6 seconds… measure Vital Capacity • Forced Expiratory Volume in one second (FEV1) • Ratio: FEV1 / FVC = 70% to 85%
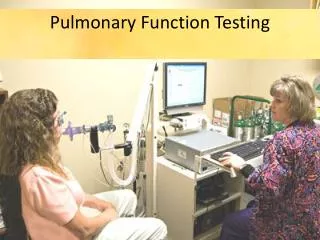
Office Spirometry: Demonstration • Enter demographic data (gender, age, height) • Zero transducer, place noseclip on patient • Tidal breaths, then maximum IC maneuver • Then…. Coach to “blast out”… push, push to RV, than maximum IVC back to TLC
PFTs- Aging • Loss of elastic tissue causes decreased Pl • See increased RV… air trapping • TLC constant • Therefore VC decreases, RV/TLC increases • FEV1 decreases, FEV1/VC decreases to about 70% in1 normal geriatric populations • Cohort effect! Survivors!
Loss of Function Over time • FEV1 4.0 L at age 30, 3.5L at age 60. 500 ml / 30 years = loss of 16 ml / year • Smokers have accelerated loss of function • Pulmonary disease have even more accelerated loss of function… do serial testing!
Flow Volume Loops • Same data as timed vital capacity • Pattern read! • Peak expiratory flow occurs at about 80% of FVC • Expiratory flows decrease as FVC decreases • Effort independent slope… dynamic airway collapse
Reasons Why Expiratory Flow Decreases As Lung Volume Decreases • Lung recoil decreases • Airway resistance increases • Airways begin to close (when pressures outside exceed pressures inside), then these units drop out of expiration • RV occurs when ALL airways are closed (or when expiratory effort stops)
Case Review: NORMAL patient • FEV1 BD response • FVC • FEV1/FVC %. • RV • TLC • RV/TLC % • DlCO (% predicted)
Clinical Examples: Objectives • Differentiate between the two broad categories of restrictive and obstructive lung disease, including the spirometric abnormalities associated with each category. • Describe the effect of aging on lung volumes, lung and chest wall compliance, blood gases, and respiratory control.
Upper Airway Obstruction Pattern • Note plateau of flow (IE recoil, resistance and airway closure are changing but flow is not) • Fixed pattern… flow plateaus in inspiration as well as expiration…. Tracheal stenosis • Variable patterns… flow plateau during inspiration but not expiration… see with vocal cord paralysis.
Upper Airway Obstruction Variable: I, not E Variable: E, not I Fixed: I and E
Flow Volume Curve in Obesity Tidal breathing occurs at low lung volume… LOW ERV
Flow Volume Curve in COPD Decreased expiratory flows… concave to volume axis
Flow Volume Curves in COPD Pre Bronchodilator: Best FEV1 = 0.55 liters Post Bronchodilator: Best FEV1 = 1.0 liters
FEV1 / FVC in disease • Obstructive Pulmonary Diseases lower FEV1/FVC% • 60-70% - mild OPD • 50-60% - moderate OPD • <50% - severe OPD • Bronchodilator response to B2 agonist aerosol …see >15% increase FEV1… think asthma • Intrapulmonary Restrictive Disease- see increased FEV1/FVC% (>90%) due to lung recoil and airway resistance
Emphysema • Loss of alveolar structure by increased proteolytic breakdown, destruction of elastic tissue in alveolar walls • Decreased Expiratory flows, FEV1/VC • Increased air trapping, RV/TLC • Decreased capillary surface area for gas exchange • No Response to BD challenge
Static Hyperinflation with COPD Progression Normal COPD VC smaller RV bigger
Dynamic Hyperinflation After Hyperventilation in COPD Decreased IC, Increased FRC
“Hyperinflation Causes Dyspnea in COPD”: Demonstration • Mild COPD…. minimal static and dynamic hyperinflation, not much change with exercise. • Severe COPD... significant static and dynamic hyperinflation. A large increase in dynamic hyperinflation occurs with exercise causes mechanical disadvantage of diaphragm, causes breathlessness, exercise limitation.
Case Review: COPD- patient • FEV1 BD response • FVC • FEV1/FVC % • RV • TLC • RV/TLC % • DlCO (% predicted)
Asthma • Increased airway reactivity • Attacks of bronchospasm, wheezing. • Decreased FEV1/VC%, but may improve with BD Rx… reversible OPD • Air trapping (increased RV/TLC%)
Flow Volume Curve in Asthma Increase in flows following bronchodilator Rx
Flow Volume Curve in Asthma Decrease in flows following provocation challenge, IE methacholine, cold air, exercise, etc
Case Review: ASTHMA patient • FEV1 BD response • FVC • FEV1/FVC %. • RV • TLC • RV/TLC % • DlCO (% predicted)
Pulmonary Fibrosis- Intrapulmonary • Increased lung inflammation causes deposition of collagen, increases lung recoil • TLC reduced (all subdivisions of lung volumes also reduced) • FEV1/VC % increased because of increased lung recoil, decreased airway resistance
Case Review: LUNG FIBROSIS • FEV1 BD response • FVC • FEV1/FVC %. • RV • TLC • RV/TLC % • DlCO (% predicted)
Diffusing Capacity of the Lung for Carbon Monoxide • CO is test gas because same MW as O2, blood • Ml CO / mm Hg/ min • Single breath test: Breath in VC breath of 0.1% CO, breath hold 10 seconds, exhale, measure CO in expiratory gas.
Diffusing Capacity of the Lung for Carbon Monoxide • Low in Emphysema (reduced surface area for diffusion) • Low in IPF • Low in Anemia (less HB taking up CO) • Artifact: Low in smokers because COHB causes back pressure of CO… violates test assumptions
Pulse Oximetry • Capillary pulse brings arterial blood to fingers • Only red color changes with pulse! • Device senses pulse, records red light (oxyhemoglobin),and blue light (deoxyhemoglobin); pulse rate displayed • % Saturation = red / red+ blue • Neglects other hemoglobins, such as CO Hb. (high CO Hb would overestimate %Sat)
PFTs- Summary • Look at TLC… is there RLD? • Look at FEV1/VC% … is there OPD? • Look at supporting data… RV/TLC % • Look at normal values, changes in data over time, comparison pre and post BD • Look at DlCO for supporting information