
Breast Cancer Risk Factors: Study Findings & Analysis
Discover how breast volume & dense area affect cancer risk in women with detailed regression analyses revealing significant associations based on age, BMI, ethnicity, parity, menopausal status, OC & HT use.

Breast Cancer Risk Factors: Study Findings & Analysis
E N D
Presentation Transcript
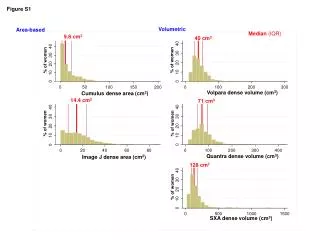
40 40 30 30 % of women % of women 20 20 10 10 0 0 0 50 100 150 200 0 100 200 300 Volpara dense volume (cm3) Cumulus dense area (cm2) 40 40 30 30 % of women % of women 20 20 10 10 0 0 0 20 40 60 80 0 100 200 300 400 Quantra dense volume (cm3) Image J dense area (cm2) 40 30 % of women 20 10 0 0 500 1000 1500 SXA dense volume (cm3) Figure S1 Volumetric Area-based Median (IQR) 9.8 cm2 40 cm3 14.4 cm2 71 cm3 128 cm3
15 15 10 10 % of women % of women 5 5 0 0 0 100 200 300 400 500 0 1000 2000 3000 Cumulus breast area (cm2) Volpara breast volume (cm3) 15 10 8 10 6 % of women % of women 4 5 2 0 0 50 100 150 200 250 300 0 500 1000 1500 2000 2500 Quantra breast volume (cm3) ImageJ breast area (cm2) 15 10 % of women 5 0 0 500 1000 1500 2000 2500 SXA breast volume (cm3) Figure S2 Volumetric Area-based Median (IQR) 603 cm3 145 cm2 479 cm3 128 cm2 606 cm3
3.5 3 2.5 Natural-log of Volpara PD 2 1.5 80 1 r=0.86 60 0 2 4 6 8 10 Cumulus PD 4 Cumulus PD 40 3.5 20 Natural-log of Quantra PD 3 0 8 2.5 1 2 3 4 r=0.81 6 2 0 2 4 6 8 10 5 Cumulus PD Square-root of ImageJ-based PD 4 4 2 Natural-log of SXA PD r=0.92 3 0 0 2 4 6 8 10 2 Square-root of Cumulus PD r=0.77 1 0 2 4 6 8 10 Square-root of Cumulus PD Figure S3 Volpara vs. Cumulus Cumulus vs. BIRADS Quantra vs. Cumulus ImageJ-based method vs. Cumulus 4 (≥75%) 2 (25-49%) 3 (50-74%) 1 (<25%) SXA vs. Cumulus
6 5 • Natural-log of Volpara Dense Volume 4 3 r=0.41 2 0 5 10 15 6 Cumulus Dense Area 10 5 8 • Natural-log of Quantra Dense Volume 4 6 Square-root of ImageJ-based Dense Area 4 3 r=0.13 r=0.90 2 2 0 5 10 15 Cumulus Dense Area 7 0 0 5 10 15 6 Square-root of Cumulus Dense Area 5 Natural-log of SXA Dense Volume 4 r=0.23 3 0 5 10 15 Square-root of Cumulus Dense Area Figure S4 Volpara vs. Cumulus ImageJ-based method vs. Cumulus Quantra vs. Cumulus SXA vs. Cumulus
8 7 • Natural-log of Volpara Breast Volume 6 5 r=0.93 4 5 10 15 20 8 Cumulus Total Breast Area 20 7 15 • Natural-log of Quantra Breast Volume 6 Square-root of Image J-based Breast Area 10 5 r=0.95 r=0.99 4 5 5 10 15 20 5 10 15 20 8 Cumulus Total Breast Area Square-root of Cumulus Breast Area 7 • Natural-log of SXA Total Breast Volume 6 5 r=0.94 4 5 10 15 20 Square-root of Cumulus Breast Area Figure S5 Volpara vs. Cumulus ImageJ-based method vs. Cumulus Quantra vs. Cumulus SXA vs. Cumulus
Cumulus Dense Area (cm2) ImageJ-based Dense Area (cm2) Regression Regression coefficient (95% CI) Coefficient (95% CI) coefficient (95% CI) Age (yrs) Age (yrs) 44-53 0 44-53 0 54-57 -0.20 (-0.43, 0.03) -0.20 (-0.43, 0.03) 54-57 -0.23 (-0.49, 0.03) -0.23 (-0.49, 0.03) 58-62 -0.12 (-0.35, 0.12) -0.12 (-0.35, 0.12) 58-62 -0.20 (-0.47, 0.07) -0.20 (-0.47, 0.07) 63-69 -0.32 (-0.56, -0.07) -0.32 (-0.56, -0.07) 63-69 -0.30 (-0.57, -0.03) -0.30 (-0.57, -0.03) 70+ -0.56 (-0.90, -0.21) -0.56 (-0.90, -0.21) 70+ -0.51 (-0.89, -0.13) -0.51 (-0.89, -0.13) BMI (kg/m2) BMI (kg/m2) 0.18 (-0.10, 0.47) 0.32 (0.05, 0.60) <20 0.32 (0.05, 0.60) <20 0.18 (-0.10, 0.47) 20- 0 20- 0 25- -0.40 (-0.57, -0.23) -0.40 (-0.57, -0.23) 25- -0.42 (-0.61, -0.23) -0.42 (-0.61, -0.23) 30+ -0.81 (-1.00, -0.62) -0.81 (-1.00, -0.62) 30+ -0.85 (-1.10, -0.60) -0.85 (-1.10, -0.60) Ethnicity Ethnicity White 0 White 0 Other -0.14 (-0.32, 0.03) -0.14 (-0.32, 0.03) Other -0.15 (-0.35, 0.05) -0.15 (-0.35, 0.05) Parity Parity No 0 No 0 Yes -0.37 (-0.52, -0.22) -0.37 (-0.52, -0.22) Yes -0.35 (-0.52, -0.18) -0.35 (-0.52, -0.18) Menopausal status Menopausal status Pre & Peri 0 Pre & Peri 0 Post -0.48 (-0.73, -0.22) -0.48 (-0.73, -0.22) Post -0.42 (-0.71, -0.13) -0.42 (-0.71, -0.13) Ever OC use Ever OC use No 0 No 0 Yes 0.12 (-0.04, 0.28) 0.12 (-0.04, 0.28) Yes 0.07 (-0.12, 0.26) 0.07 (-0.12, 0.26) Ever HT Ever HT No 0 No 0 Yes 0.02 (-0.14, 0.18) 0.02 (-0.14, 0.18) Yes 0.08 (-0.10, 0.26) 0.08 (-0.10, 0.26) -.999 0 0 .999 -1.1 0 0 1.1 Volpara Dense Volume (cm3) Quantra Dense Volume (cm3) SXA Dense Volume (cm3) Regression Regression Regression coefficient (95% CI) coefficient (95% CI) coefficient (95% CI) Age (yrs) Age (yrs) Age (yrs) 44-53 0 44-53 0 44-53 0 54-57 -0.10 (-0.34, 0.15) -0.10 (-0.34, 0.15) 54-57 0.03 (-0.20, 0.26) 0.03 (-0.20, 0.26) 54-57 0.03 (-0.21, 0.27) 0.03 (-0.21, 0.27) 58-62 -0.01 (-0.26, 0.24) -0.01 (-0.26, 0.24) 58-62 0.12 (-0.12, 0.36) 0.12 (-0.12, 0.36) 58-62 0.07 (-0.18, 0.32) 0.07 (-0.18, 0.32) 63-69 -0.29 (-0.54, -0.03) -0.29 (-0.54, -0.03) 63-69 -0.09 (-0.33, 0.15) -0.09 (-0.33, 0.15) 63-69 -0.11 (-0.37, 0.14) -0.11 (-0.37, 0.14) 70+ -0.27 (-0.63, 0.10) -0.27 (-0.63, 0.10) 70+ -0.01 (-0.36, 0.34) -0.01 (-0.36, 0.34) 70+ -0.06 (-0.42, 0.30) -0.06 (-0.42, 0.30) BMI (kg/m2) BMI (kg/m2) BMI (kg/m2) -0.69 (-0.98, -0.40) -0.53 (-0.81, -0.25) -0.61 (-0.90, -0.31) <20 -0.69 (-0.98, -0.40) <20 -0.53 (-0.81, -0.25) <20 -0.61 (-0.90, -0.31) 20- 0 20- 0 20- 0 25- 0.37 (0.19, 0.55) 0.37 (0.19, 0.55) 25- 0.60 (0.43, 0.77) 0.60 (0.43, 0.77) 25- 0.54 (0.36, 0.72) 0.54 (0.36, 0.72) 30+ 0.54 (0.34, 0.74) 0.54 (0.34, 0.74) 30+ 1.06 (0.86, 1.25) 1.06 (0.86, 1.25) 30+ 0.80 (0.60, 1.00) 0.80 (0.60, 1.00) Ethnicity Ethnicity Ethnicity White 0 White 0 White 0 Other -0.06 (-0.24, 0.13) -0.06 (-0.24, 0.13) Other -0.02 (-0.20, 0.15) -0.02 (-0.20, 0.15) Other 0.08 (-0.10, 0.27) 0.08 (-0.10, 0.27) Parity Parity Parity No 0 No 0 No 0 Yes -0.24 (-0.40, -0.07) -0.24 (-0.40, -0.07) Yes -0.09 (-0.24, 0.07) -0.09 (-0.24, 0.07) Yes -0.21 (-0.37, -0.04) -0.21 (-0.37, -0.04) Menopausal status Menopausal status Menopausal status Pre & Peri 0 Pre & Peri 0 Pre & Peri 0 Post -0.40 (-0.67, -0.13) -0.40 (-0.67, -0.13) Post -0.34 (-0.60, -0.08) -0.34 (-0.60, -0.08) Post -0.54 (-0.81, -0.27) -0.54 (-0.81, -0.27) Ever OC use Ever OC use Ever OC use No 0 No 0 No 0 Yes 0.17 (-0.01, 0.34) 0.17 (-0.01, 0.34) Yes 0.16 (-0.00, 0.33) 0.16 (-0.00, 0.33) Yes 0.23 (0.06, 0.40) 0.23 (0.06, 0.40) Ever HT Ever HT Ever HT No 0 No 0 No 0 Yes 0.13 (-0.04, 0.30) 0.13 (-0.04, 0.30) Yes 0.09 (-0.07, 0.26) 0.09 (-0.07, 0.26) Yes 0.07 (-0.10, 0.25) 0.07 (-0.10, 0.25) -.978 0 0 .978 -1.25 0 0 1.25 -1 0 0 1 Figure S6 Pt=0.08 Pt=0.01 Pt<0.0001 Pt<0.0001 P=0.14 P=0.10 P<0.0001 P<0.001 P<0.0001 P<0.01 P=0.14 P=0.50 P=0.35 P=0.77 No. SDs No. SDs Pt=0.42 Pt=0.57 Pt=0.08 Pt<0.0001 Pt<0.0001 Pt<0.0001 P=0.80 P=0.37 P=0.37 P=0.25 P=0.01 P<0.01 P<0.01 P=0.01 P<0.001 P=0.06 P=0.05 P=0.01 P=0.13 P=0.38 P=0.25 No. SDs No. SDs No. SDs
ImageJ-based Non-Dense Area (cm2) Cumulus Non-Dense Area (cm2) Regression Regression coefficient (95% CI) coefficient (95% CI) Age (yrs) Age (yrs) 44-53 0 44-53 0 54-57 0.20 (0.01, 0.39) 0.20 (0.01, 0.39) 54-57 0.17 (-0.06, 0.39) 0.17 (-0.06, 0.39) 58-62 0.23 (0.03, 0.42) 0.23 (0.03, 0.42) 58-62 0.17 (-0.07, 0.40) 0.17 (-0.07, 0.40) 63-69 0.24 (0.04, 0.44) 0.24 (0.04, 0.44) 63-69 0.14 (-0.10, 0.37) 0.14 (-0.10, 0.37) 70+ 0.55 (0.26, 0.84) 0.55 (0.26, 0.84) 70+ 0.43 (0.10, 0.76) 0.43 (0.10, 0.76) BMI (kg/m2) BMI (cm2) -0.92 (-1.14, -0.69) -0.87 (-1.11, -0.62) <20 -0.92 (-1.14, -0.69) <20 -0.87 (-1.11, -0.62) 20- 0 20- 0 25- 0.77 (0.63, 0.91) 0.77 (0.63, 0.91) 25- 0.81 (0.64, 0.97) 0.81 (0.64, 0.97) 30+ 1.41 (1.25, 1.56) 1.41 (1.25, 1.56) 30+ 1.30 (1.08, 1.52) 1.30 (1.08, 1.52) Ethnicity Ethnicity White 0 White 0 Other 0.04 (-0.10, 0.19) 0.04 (-0.10, 0.19) Other 0.06 (-0.11, 0.23) 0.06 (-0.11, 0.23) Parity Parity No 0 No 0 Yes 0.25 (0.12, 0.37) 0.25 (0.12, 0.37) Yes 0.25 (0.10, 0.40) 0.25 (0.10, 0.40) Menopausal status Menopausal status Pre & Peri 0 Pre & Peri 0 Post 0.04 (-0.17, 0.25) 0.04 (-0.17, 0.25) Post 0.08 (-0.17, 0.33) 0.08 (-0.17, 0.33) Ever OC use Ever OC use No 0.00 (-0.00, 0.00) 0.00 (-0.00, 0.00) No 0 Yes -0.03 (-0.17, 0.10) -0.03 (-0.17, 0.10) Yes -0.06 (-0.22, 0.10) -0.06 (-0.22, 0.10) Ever HT Ever HT No 0.00 (-0.00, 0.00) 0.00 (-0.00, 0.00) No 0 Yes 0.08 (-0.05, 0.22) 0.08 (-0.05, 0.22) Yes 0.10 (-0.06, 0.26) 0.10 (-0.06, 0.26) -1.56 0 0 1.56 -1.52 0 0 1.52 Volpara Non-Dense Volume (cm3) Quantra Non-Dense Volume (cm3) SXA Non-Dense Volume (cm3) Regression Regression Regression coefficient (95% CI) coefficient (95% CI) coefficient (95% CI) Age (yrs) Age (yrs) Age (yrs) 44-53 0 44-53 0 44-53 0 54-57 0.09 (-0.09, 0.28) 0.09 (-0.09, 0.28) 54-57 0.12 (-0.07, 0.31) 0.12 (-0.07, 0.31) 54-57 0.16 (-0.04, 0.36) 0.16 (-0.04, 0.36) 58-62 0.11 (-0.08, 0.29) 0.11 (-0.08, 0.29) 58-62 0.12 (-0.08, 0.31) 0.12 (-0.08, 0.31) 58-62 0.13 (-0.08, 0.33) 0.13 (-0.08, 0.33) 63-69 0.07 (-0.13, 0.26) 0.07 (-0.13, 0.26) 63-69 0.04 (-0.17, 0.24) 0.04 (-0.17, 0.24) 63-69 0.14 (-0.07, 0.35) 0.14 (-0.07, 0.35) 70+ 0.30 (0.03, 0.57) 0.30 (0.03, 0.57) 70+ 0.29 (0.01, 0.58) 0.29 (0.01, 0.58) 70+ 0.44 (0.14, 0.74) 0.44 (0.14, 0.74) BMI (kg/m2) BMI (kg/m2) BMI (kg/m2) -1.29 (-1.50, -1.07) -1.19 (-1.42, -0.96) -1.47 (-1.71, -1.22) <20 -1.29 (-1.50, -1.07) <20 -1.19 (-1.42, -0.96) <20 -1.47 (-1.71, -1.22) 20- 0 20- 0 20- 0 25- 0.85 (0.72, 0.99) 0.85 (0.72, 0.99) 25- 0.85 (0.71, 0.99) 0.85 (0.71, 0.99) 25- 0.76 (0.61, 0.91) 0.76 (0.61, 0.91) 30+ 1.38 (1.22, 1.53) 1.38 (1.22, 1.53) 30+ 1.38 (1.22, 1.53) 1.38 (1.22, 1.53) 30+ 1.19 (1.03, 1.36) 1.19 (1.03, 1.36) Ethnicity Ethnicity Ethnicity White 0 White 0 White 0 Other -0.02 (-0.16, 0.12) -0.02 (-0.16, 0.12) Other -0.01 (-0.16, 0.14) -0.01 (-0.16, 0.14) Other -0.02 (-0.18, 0.13) -0.02 (-0.18, 0.13) Parity Parity Parity No 0 No 0 No 0 Yes 0.06 (-0.06, 0.18) 0.06 (-0.06, 0.18) Yes 0.07 (-0.05, 0.20) 0.07 (-0.05, 0.20) Yes 0.09 (-0.05, 0.23) 0.09 (-0.05, 0.23) Menopausal status Menopausal status Menopausal status Pre & Peri 0 Pre & Peri 0 Pre & Peri 0 Post 0.00 (-0.20, 0.21) 0.00 (-0.20, 0.21) Post -0.02 (-0.23, 0.20) -0.02 (-0.23, 0.20) Post 0.09 (-0.13, 0.32) 0.09 (-0.13, 0.32) Ever OC use Ever OC use Ever OC use No 0 No 0 No 0 Yes 0.04 (-0.09, 0.17) 0.04 (-0.09, 0.17) Yes 0.03 (-0.10, 0.17) 0.03 (-0.10, 0.17) Yes 0.00 (-0.14, 0.15) 0.00 (-0.14, 0.15) Ever HT Ever HT Ever HT No 0 No 0 No 0 Yes 0.11 (-0.02, 0.23) 0.11 (-0.02, 0.23) Yes 0.11 (-0.02, 0.24) 0.11 (-0.02, 0.24) Yes 0.11 (-0.03, 0.25) 0.11 (-0.03, 0.25) -1.53 0 0 1.53 -1.53 0 0 1.53 -1.71 0 0 1.71 Figure S7 Pt<0.01 Pt=0.15 Pt<0.0001 Pt<0.0001 P=0.55 P=0.52 P<0.01 P<0.01 P=0.70 P=0.53 P=0.61 P=0.47 P=0.21 P=0.21 No. SDs No. SDs Pt=0.15 Pt=0.07 Pt=0.29 Pt<0.0001 Pt<0.0001 Pt<0.0001 P=0.81 P=0.90 P=0.76 P=0.34 P=0.25 P=0.19 P=0.41 P=0.99 P=0.87 P=0.51 P=0.64 P=0.97 P=0.10 P=0.10 P=0.13 No. SDs No. SDs No. SDs


