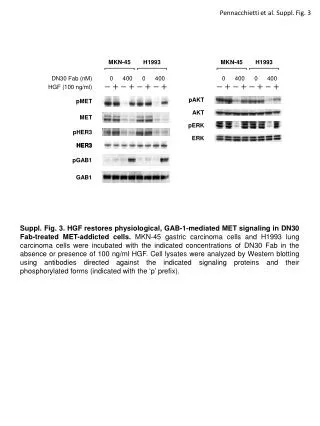
Suppl.3
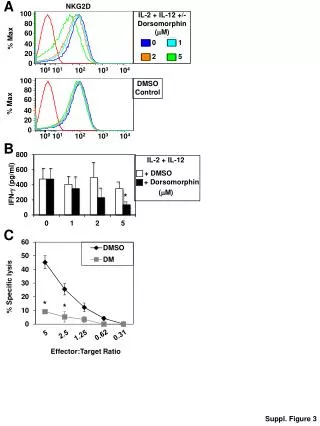
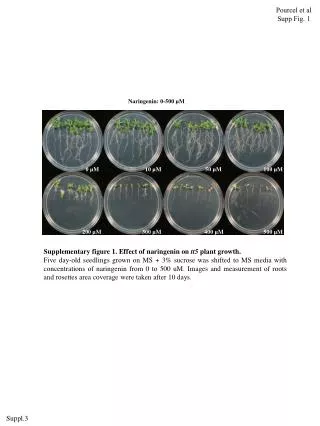
Pourcel et al Supp Fig. 1. Naringenin: 0-500 µM. 0 µM. 10 µM. 50 µM. 100 µM. 200 µM. 300 µM. 400 µM. 500 µM. Supplementary figure 1. Effect of naringenin on tt5 plant growth.

Suppl.3
E N D
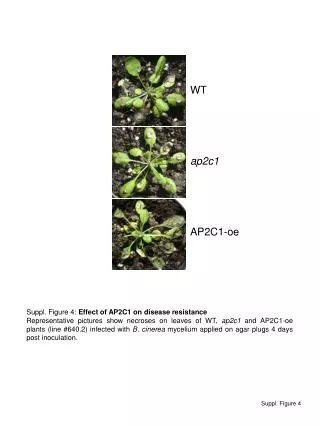
Presentation Transcript
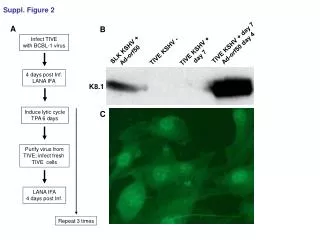
Pourcel et al Supp Fig. 1 Naringenin: 0-500 µM 0 µM 10 µM 50 µM 100 µM 200 µM 300 µM 400 µM 500 µM Supplementary figure 1.Effect of naringenin on tt5 plant growth. Five day-old seedlings grown on MS + 3% sucrose was shifted to MS media with concentrations of naringenin from 0 to 500 uM. Images and measurement of roots and rosettes area coverage were taken after 10 days. Suppl.3
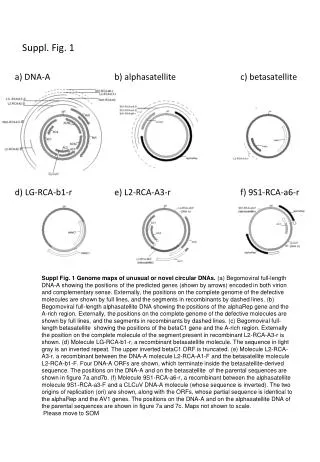
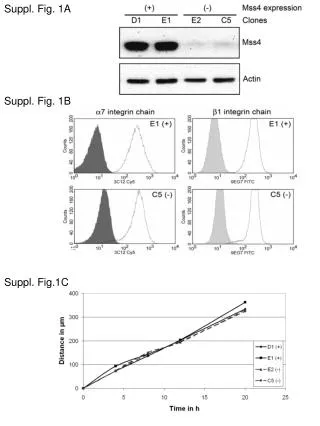
516.6 516.6 281.1 281.1 332.2 326.3 300 400 500 600 300 400 500 600 nm nm 2 2 4 4 6 6 8 8 10 10 12 12 14 14 16 16 Pourcel et al Supp Fig. 2 Ler + Nar A peak d C3G Standard Minutes B C3G standard Peak d C Supplementary figure 2.Peak “d” and Cyanidin-3-glucosyde characterization. (A) Chromatograms of Ler + naringenin (Nar) anthocyanin extract and cyanidin-3-glucoside (C3G) standard. (B) Peak “d” and C3G absorbance spectra. (C) C3G molecule.
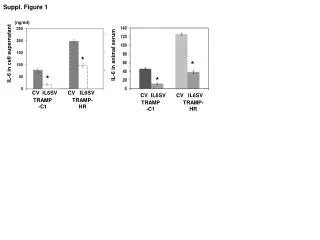
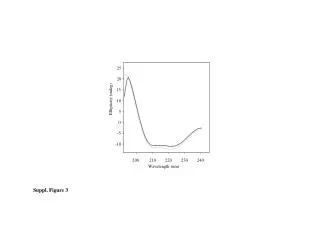
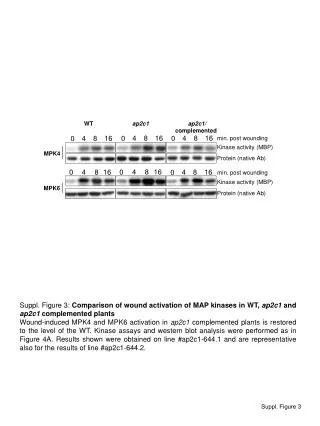
x 105 5 4 3 Peak area (uV*sec) 2 1 0 0 3h 6h 9h 12h 24h 1/c 2 3 4 5 6 7 8 9 10 11 12 13 Pourcel et al Supp Fig. 3 Time after naringenin induction (hour) Supplementary figure 3. Time course accumulation of anthocyanin after naringenin addition. 3 day-old seedlings grown in 3% sucrose are induced with 100 µM naringenin for 24 hrs. Quantification os based on peak area measurrmrnt of HPLC chromatogram at 520 nm (µVol*sec).
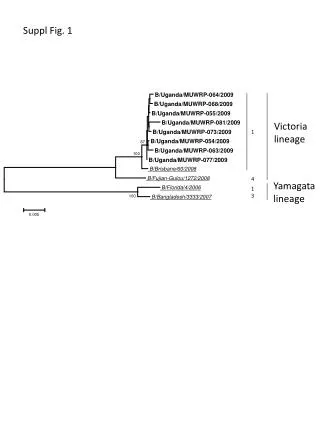
Pourcel et al Supp Fig. 4 Supplementary figure 4. Structure of the Most Highly Decorated Arabidopsis Anthocyanin. Structure of cyanidin 3-O-[2’’-O-(6’’’-O-{(sinapoyl) xylosyl} 6’’-O-(p-O-(glucosyl)-p-coumaroyl) glucoside] 5-O-(6’’’’-O-malonyl) glucoside, corresponding to A11 in (Tohge et al., 2005) and likely to peak 6 (Table 1). The anthocyanidin chromophore is shown in red and the positions of the 3-O and 5-O decorations indicated as 3 and 5 respectively.
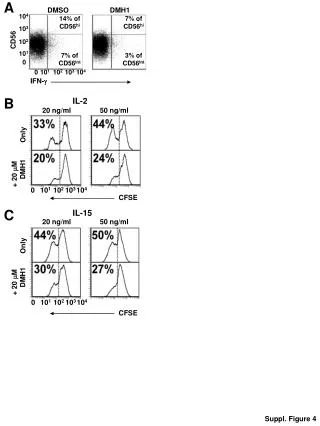
Pourcel et al Supp Fig. 5 Col 5gt D A B Stem bottom Stem bottom C D Rosette leaves Rosette leaves Supplementary figure 5.Anthocyanin accumulation in Col and 5gt. (A and B) Bottom of the stem and (B and D) adaxial side of the rosette leaves. Red arrows indicate AVIs inside the cells. Scale bars: (A,B), 5 µM; (C,D), 30 µM. (D) Schematic of Arabidopsis plant indicating the tissues observes for AVIs.