Impact of LPS Concentrations on Gap Junction Function and Connexin43 Expression in NRK52E Cells
This study examines the effects of various concentrations of lipopolysaccharides (LPS) on gap junction function and the expression of Connexin43 (Cx43) in NRK52E cells. Using a parachute dye-coupling assay and Western blot analysis, we observe a dose-dependent inhibition of gap junction communication and Cx43 expression. Additionally, electron microscopy reveals morphological changes in NRK52E cells treated with LPS, including irregular shapes and diminished cellular structures, indicating alterations in cell integrity and functionality due to LPS exposure.

Impact of LPS Concentrations on Gap Junction Function and Connexin43 Expression in NRK52E Cells
E N D
Presentation Transcript
Supplemental Digital Content 1 Supplemental Digital Content 2 Supplemental Digital Content 3 Supplemental Digital Content 4
Supplemental Digital Content 5 Supplemental Digital Content 6 Supplemental Digital Content 7 Supplemental Digital Content 8
Supplemental Digital Content 9 Supplemental Digital Content 10 Supplemental Digital Content 11
Supplemental Digital Content 12 Supplemental Digital Content 14 Supplemental Digital Content 13
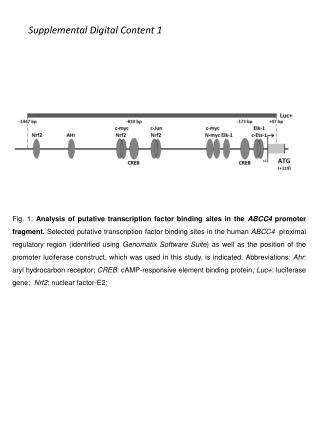
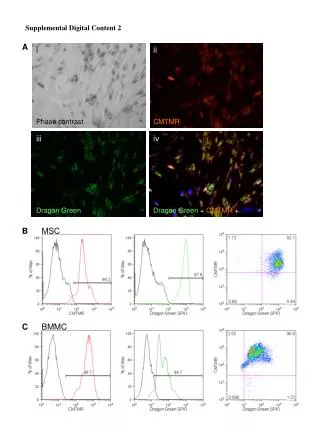
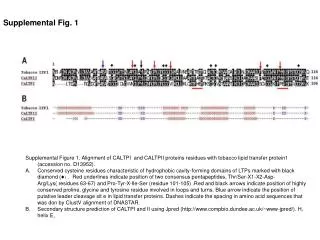
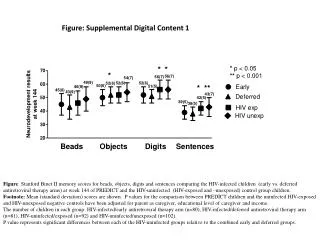
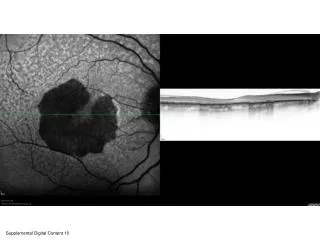
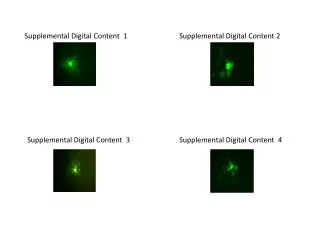
Supplemental Digital Content Figure Legends SDC 1-10: Illustrates the GJ function altered in response to exposure to various LPS concentrations. The parachute dye-coupling assay was performed on high-density cells that were (SDC 1) untreated (control group) or exposed to LPS at (SDC 2) 10 ng/mL, (SDC 3) 50 ng/mL, (SDC 4) 100 ng/mL, (SDC 5) 500 ng/mL, and (SDC 6) 1000 ng/mL, (SDC 7) retinoic acid at 10 mol, (SDC 8) oleamide at 25µM, (SDC 9) oleamide at 25µM + LPS at 100 ng/mL, and (SDC 10) retinoic acid at 10 µM + LPS at 100ng/mL. Dye transmission was observed by fluorescent microscope, 200× magnification SDC 11: Illustrates that LPS inhibited the expression of Connexin43 in NRK52E cells. Cells at high density were either (a) untreated (control group) or treated with LPS at (b) 10 ng/mL or (c) 100 ng/mL and Cx43 protein expression detected by Western blot. SDC 12-14: Illustrates the LPS-induced changes in pathobiological features of NRK52E cells. Electron microscopy analysis of (a) untreated NRK52E cells appeared as regularly-shaped globular structures with normal polarity, plentiful organelles, and integrated cell membranes having plenty of microvilli structures on the surface. (b) NRK52E cells treated with 100 ng/mL LPS appeared as irregularly-shaped globular structures with less integrated cell membrane, fewer organelles, microvilli, and connective structures, such as gap junctions. (c) NRK52E cells treated with 1000 ng/mL LPS showed cytoplasmic and karyoplasmic swelling and a remarkable absence of microvilli.