Download

1 / 0
Pictograms and Line Graphs
0 likes | 174 Vues
Pictograms and Line Graphs. August 24, 2011. Vocabulary. Define the following words on your vocabulary sheet: Line Graph Trend Deviations You will have 5 mins alone and then 5 mins with your elbow partner. Pictogram.
Télécharger la présentation 
Pictograms and Line Graphs
An Image/Link below is provided (as is) to download presentation
Download Policy: Content on the Website is provided to you AS IS for your information and personal use and may not be sold / licensed / shared on other websites without getting consent from its author.
Content is provided to you AS IS for your information and personal use only.
Download presentation by click this link.
While downloading, if for some reason you are not able to download a presentation, the publisher may have deleted the file from their server.
During download, if you can't get a presentation, the file might be deleted by the publisher.
E N D
Presentation Transcript
-
Pictograms and Line Graphs
August 24, 2011 - Vocabulary Define the following words on your vocabulary sheet: Line Graph Trend Deviations You will have 5 mins alone and then 5 mins with your elbow partner.
- Pictogram A pictogram is a type of bar graph that uses pictures instead of bars to represent the data being looked at. Why would a pictogram be misleading? Look at the picture on page 209 and talk to your elbow partner about why this graph could be misleading.
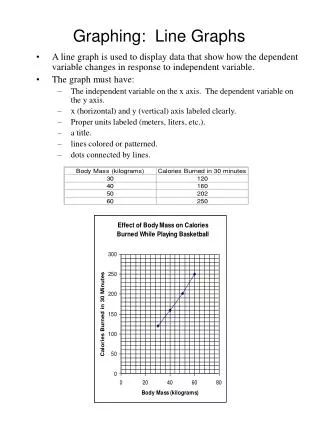
- Line Graphs Evaluate when to use a line graph instead of a pie chart or bar graph. What can we infer about a line graph and its data points? Review what makes a good graph.
- Practice Problems Page 214 Problems number 4.6 and 4.7 need to be answered in complete, thoughtful sentences. When everyone finishes we will discuss the answers. You will keep these problems in your notes to use to study and review.
- Practice problems and their answers Problem 7 The graph does not fairly represent the data. The area of each CD is more than the percent increase. Problem 6 The graph is not a correct comparison because the differences between the interest rates seems to be much larger than they really are.
- Application 4.1 College Students and Credit Cards Page 218 In pairs answer questions 1-5 on your handout. Make sure to answer in complete sentences. 1. More than half of college freshmen have credit cards and it jumps to almost 100% by their senior year. The Average credit card debit for freshmen is about $1533 and for seniors is almost $3300. 2. There was about a 42% increase 3. The average credit card debt rose more than 100%
- Part 4 The percent of students with cards increases over time
- Part 5 The average debt goes up during the years. Why would this happen?
- Problems for homework Page 219 14, 15, 16Make sure to get all the information written down you will need to complete the work. Due Friday


More Related