Download
1 / 21
210 likes | 395 Vues
Burst firing in sensory systems. Jaeseung Jeong, Ph.D Department of Bio and Brain Engineering, KAIST.

E N D
Burst firing in sensory systems Jaeseung Jeong, Ph.D Department of Bio and Brain Engineering, KAIST
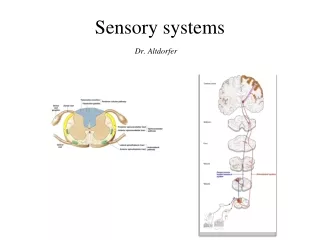
a | Top, cerebellar granule cell (biocytin, unpublished data of C. Roussel, D. Gall, E. D'Angelo and S. Shiffmann). A model of in vitro bursting relies on seven conductances (schematic electrotonic structure and conductance list, middle left). High-frequency burst spikes rely on fast Na+ (INa,s), delayed rectifier (IDr,s) and fast afterhyperpolarization (AHP, IK(Ca)) currents (middle right). The Ca2+-dependent K+ current, IK(Ca), is activated by a Ca2+ conductance, ICa. A resurgent Na+ current, INaR, mediates the depolarizing afterpotential (DAP). Bursting is favoured by a persistent Na+ current (INaP) and terminated by a slow K+ current (IK-slow). Bottom, two bursts in response to a current pulse.
b | Top, thalamocortical relay cell. At depolarized membrane potentials, spikes are discharged in tonic mode (middle right). When a strong depolarization follows a period of hyperpolarization, a Ca2+ spike is activated with fast Na+/K+ spikes riding its crest (bottom). Models including a dendritic IT conductance reproduce burst patterns observed in intact cells (middle left). Note the decrease in firing frequency during the burst.
c | Top, electrosensory lateral-line lobe (ELL) pyramidal cell. Somatic spikes are narrow (middle right, 1) and propagate back into the apical dendrite where they broaden owing to slower dendritic conductances, INa,d and IDr,d (2). Current sourcing back into the soma causes a DAP (3). Bottom, somatic and dendritic spike bursts recorded separately in two cells (somatic spikes truncated). The slowdown in dendritic spike repolarization is due to slow inactivation of a dendritic K+ conductance (IKv3.3) and results in a potentiation of the somatic DAP (arrows). When the DAP reaches threshold for a high-frequency spike doublet, the second spike fails to backpropagate. This allows the AHP to terminate the burst. Note the increase in firing frequency during the burst.
a | The principal neurons of the ELL are E- and I-type pyramidal cells (E- and I-units) reminiscent of ON- and OFF-type relay cells of the lateral geniculate nucleus (LGN) in the thalamus. Both LGN relay cells and ELL pyramidal cells have concentric centre–surround receptive fields (RF). When stimulated with sinusoidal amplitude modulations/sinusoidal drifting gratings, E-units or ON-cells fire action potentials in response to increases in stimulus amplitude in the centre of the receptive field, whereas I-units or OFF-cells respond to amplitude decreases.
b | Simplified circuitry of the LGN. Feedback from the cortex is topographic, in register with its LGN target projections. Input from the brainstem is diffuse, affecting a large part of the LGN. c | Simplified sketch of ELL circuitry. Topographically precise feedback is shown in orange, spatially diffuse inputs are in blue. EGP, eminentia granularis posterior of the cerebellum; NPD, nucleus praeeminentialis dorsalis; TRN, thalamic reticular nucleus.
a | Increase in cortical feedback gain by block of GABA ( -aminobutyric acid)-mediated inhibition changes the probability of burst firing in LGN relay cells. Each plot shows the interspike interval following a spike (ISIi+1) as a function of the preceding one (ISIi). The first spikes of bursts are marked in red and the later ones in green. Joint ISI plots for two relay cells illustrate a decrease (cell A) and an increase (cell B), respectively, in bursting after block of cortical inhibition (left versus right panels). b–d | Local and global stimuli (top and bottom insets in b) produce two distinct firing modes in ELL pyramidal cells. For local stimuli the ISI histogram is nearly exponential after the refractory period, the autocorrelogram is flat and the joint ISI plot does not have structure (b–d, top). For global stimuli the ISI histogram shows a prominent shoulder that is characteristic of interburst intervals, the autocorrelogram has an oscillatory component and the joint ISI plot shows a large number of spikes clustering along the bottom and left edges and in the bottom left corner, characteristic of spikes occurring in bursts (b–d, bottom).
Weakly electric fish, such as the South American brown ghost knifefish (Apteronotus leptorhynchus, a) generate an electric field around their body by discharging an electric organ in their tail. Electroreceptors in the skin of the fish sense perturbations of the field caused by nearby objects or conspecifics. • The South American weakly electric fish considered here discharge their electric organ periodically at frequencies between 200 and 1,200 Hz, allowing them to monitor their surroundings continuously. They are mainly active at night and often live in turbid tropical freshwaters where vision is of limited use. • Global modulations of electric field amplitude, which affect large parts of the sensory surface (the skin of the fish), occur in the context of electrocommunication, when conspecifics meet (b, left). The perturbations that are caused by small prey animals, such as insect larvae, are typically localized and affect only a limited part of the sensory surface (b, right). • Panel c shows a sample of the quasi-sinusoidal electric organ discharge (EOD) of Apteronotus albifrons recorded with one electrode located near the head and one placed next to the tail of the animal. Panel d shows the relationship between the amplitude modulation (AM) waveform and the underlying carrier signal, the EOD.
a | Sequence of events at the presynaptic terminal on arrival of two action potentials (APs) (time window indicated by blue boxes on left). Immediately before the first AP the release machinery is not active (pink bars on right). After the AP, Ca2+ enters the terminal and vesicles are released (green bars). • At synapses with low release probability, most release sites fail to release vesicles (left panel, second row). Ca2+ ions that enter the synaptic terminal owing to a single presynaptic AP can prime the release machinery (third row, orange bars), and successive spikes will elicit increased release (fourth row). 'Depressing' synapses (right) have a high probability of transmitter release for a single presynaptic AP. If the immediately releasable pool of transmitter vesicles cannot be replenished fast enough or the release machinery is refractory (third row), successive spikes will trigger less transmitter release (fourth row). • b | Left, as a consequence of facilitation, excitatory postsynaptic potentials (EPSPs) increase in amplitude over the course of a burst, eventually triggering postsynaptic APs. Right, for 'depressing', high-release-probability synapses, single spikes can elicit spikes as effectively as bursts119.
a | The tuning to spatial frequency of a sinusoidal grating drifting at a constant velocity (11 degrees s-1, left) and the tuning to velocity for a fixed temporal frequency (4 Hz, right) of a complex cell recorded in cat visual cortex is sharper for bursts than for isolated spikes. Spikes belong to bursts if they are less than 8 ms apart. • b | Burst spikes of visual cortical cells recorded in monkeys reflect more clearly than all spikes what the animal was seeing. Bursts are defined as events consisting of two spikes less than 10 ms apart. Here, the object was a static white disk on a black background (top). • The screen of the video monitor covered 60 by 45 degrees of visual angle. The monkey was rewarded for following a fixation point, so that the receptive field of the cell could be positioned over the stimulus. Spikes were mapped in the lower panels according to the position of the recorded neuron's receptive field in space at their moment of occurrence.
a | The time course of amplitude modulations (green line) can be estimated (blue line) from primary afferent spike trains with high fidelity (upper graph). • Stimulus estimation from pyramidal cells yields much poorer results (lower graph). • Note the considerably lower firing rates of pyramidal cells than of primary afferents. • b | Pyramidal cells perform significantly better than primary afferents at indicating the occurrence of behaviourally relevant stimulus features. Histograms show misclassification errors for upstrokes and downstrokes in amplitude modulation for both populations of neurons (arrows denote median values).