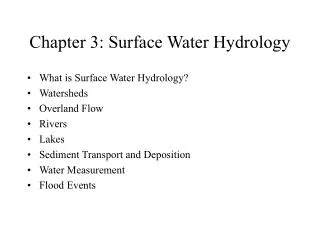
Surface Water Hydrology: Processes, History, and Management
450 likes | 538 Vues
Introduction to surface water hydrology covering major processes, historical developments, water resources engineering, and watershed characteristics. Explores the hydrologic cycle, evolution of hydrology, and advancements in computer models. Includes case studies on river basins like Guadalupe River in Texas and urban watersheds like Brays Bayou in Harris County. Learn about key concepts in hydrology, watershed management, and the impact of urban planning on flood response. Explore the intersection of natural processes and engineering interventions in managing surface water resources effectively.

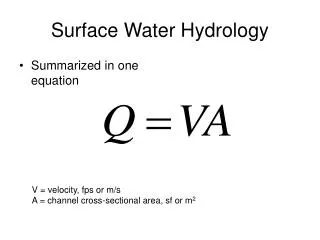
Surface Water Hydrology: Processes, History, and Management
E N D
Presentation Transcript
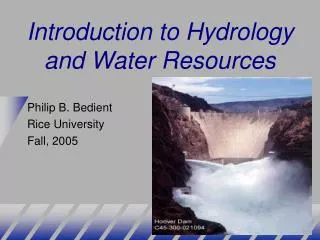
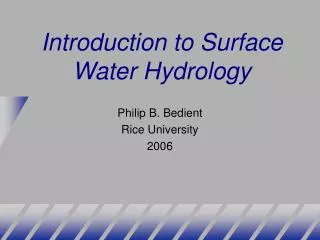
Introduction to Surface Water Hydrology2007 Philip B. Bedient Rice University
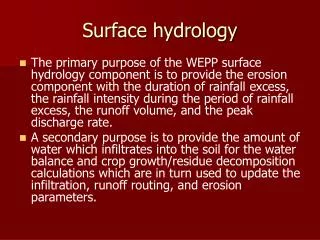
Major Hydrologic Processes • Precipitation (measured by radar or rain gage) • Evaporation or ET (loss to atmosphere) • Infiltration (loss to subsurface soils) • Overland flow (sheet flow toward nearest stream) • Streamflow (measured flow at stream gage) • Ground water flow and well mechanics • Water quality and contaminant transport (S & GW)
The Hydrologic Cycle Atmospheric Moisture P Runoff Evap ET Evap Streams Runoff GW Lake Reservoir
Atmosphere Evaporation Evaporation Precipitation Water on Surface Overland Flow Channel Flow Reservoir Evapotranspiration Ground Water Ground Water Flow Ocean The Hydrologic Cycle
History of Hydrology - 1800s • Chezy Channel Formula in the 1780s • Open channel flow experiments - 1800s • US Army Corps of Eng established (1802) • Darcy and Dupuit laws of ground water - 1850s • USGS first measured Miss River flow in 1888 • Manning’s Eqn - Open Channel Flow - 1889 • U.S. Weather Bureau 1891 (NWS) • Major Hurricane at Galveston - 1900 (8000 dead)
History of Hydrology - 1900s • Early 1900s saw great expansion of water supply and flood control dams in the western U.S. - in response to Dust Bowl and the Great Depression of the 1920s & 30s • U.S. Dept of Agriculture began many hydrologic studies • Sherman UH and Horton infiltration theory - mid 1930s • U.S. Army Corps of Engineers (1930s) - large projects • Major Hurricane at Florida - over 2000 deaths • Penman (1948) - complete theory of evaporation
Recent History of Hydrology • Great urban expansion in 1950s and 60s - led to demand for better water supply and prediction (after WW II) • EPA formed in 1970 with a mission to clean up the rivers and lakes of America - beginning of environmental science and engineering as we know it today • USGS and EPA actively involved in large-scale sampling programs at the national level - (Major Rivers & Lakes) • EPA funded development of computer models to address major water quality issues in streams and lakes, and estuarine bays.
Rainfall Availability and Associated Growth in Water Resources Engineering Projects Worldwide
Major Computer Advances • Stanford watershed Model of 1966 - first digital code • US Army Corps of Engineers Hydrologic Engineering Center (HEC) models - 1970s to the present • HEC-HMS and HEC-RAS (1990s release) • EPA in 1969 - Storm Water Mgt Model (SWMM) • USDA and others developed codes in mid 1970s • EPA currently supports a suite of advanced models for analyzing water quality in streams and lakes • Development of FEMA (1970s) - floodplain mapping and the federal flood insurance program - HEC models
The Watershed or Basin • Area of land that drains to a single outlet and is separated from other watersheds by a drainage divide. • Rainfall that falls in a watershed will generate runoff to that watershed outlet. • Topographic elevation is used to define a watershed boundary (land survey or LIDAR) • Scale is a big issue for analysis
Watershed Characteristics Divide • Size • Slope • Shape • Soil type • Storage capacity Reservoir Natural stream 1 mile Urban Concrete channel
Trinity River Basin DEMLarge Basin Scale Discrete Space Representation Continuous Space Representation River reaches and their watersheds Digital Elevation Model 30m cells TNRCC water quality segments and their watersheds
Guadalupe River - Large Basin • The Guadalupe River was one of the earliest-explored rivers in Texas • Named for Our Lady of Guadalupe by Spanish explorer Alonzo de Leon in 1689 • Major water supply and recreational river for the hill country near San Marcos - drains to coast • Largely spring fed
Mansfield Dam - medium scale • Mansfield Dam sits across a canyon at Marshall Ford on the Colorado River west of Austin, Texas • Built from 1937 to 1941 • Named in 1941 in honor of U.S. Representative J.J. Mansfield • Created a 50 mile long lake that is hundreds of feet deep in lower end
Onion Creek near Austin, TX • Limestone area • Intense rainfalls • Aquifer recharge • Very steep slopes • High flows • Clear water
Brays Bayou Harris County
Brays Bayou - small watershed Harris Gully Area: 4.5 sq. mi. Brays Bayou Area: 129 sq. mi. Rice/TMC Area Watershed Boundary
. 3 0 , 0 0 0 2 5 , 0 0 0 J u n 7 6 A p r 7 9 2 0 , 0 0 0 S e p 8 3 Flow, cfs M a r 9 2 1 5 , 0 0 0 M a r 9 7 1 0 , 0 0 0 5 , 0 0 0 2 1 8 1 4 3 6 9 1 5 1 2 2 T i m e , h r s Measured Flow at Main St Gage 29,000 cfs Time, hrs
The Woodlands - small urban scale The Woodlands planners wanted to design the ultimate community to handle a 100-year storm. In doing this, they attempted to minimize any changes to the natural floodplain as development expanded.
The Watershed Response - Hydrograph • As rain falls over a watershed area, a certain portion will infiltrate the soil. Some water will evaporate to atmosphere. • Rainfall that does not infiltrate or evaporate is available as overland flow and runs off to the nearest stream. • Smaller tributaries or streams then begin to flow and contribute their load to the main channel at confluences. • As accumulation continues, the streamflow rises to a maximum (peak flow) and a flood wave moves downstream through the main channel. • The flow eventually recedes or subsides as all areas drain out.
Watershed Response Tributary • Precipitation over the area • Portion Infiltrates the soil • Portion Evaporates or ET back • Remainder - Overland Flow • Overland flow - Channel flow • Final Hydrograph at Outlet Reservoir Natural stream Urban Concrete channel Q T
Manning’s Equation - Compute Peak Flow Q = Flowrate, cfs n = Manning’s Roughness Coefficient (ranges from 0.015 - 0.15) S = Slope of channel in longitudinal direction R = A/P, the hydraulic radius, where A = Cross-sectional Area of Flow (area of trapezoid or flow area) P = Wetted Perimeter (perimeter in contact with water) A A A P = Wetted Perimeter Pipe P = Circum. Natural Channel
Manning’s Equation Open Channels Q = Flowrate, cfs n = Manning’s Roughness Coefficient S = Longitudinal Slope of Channel or Pipe, ft/ft R = A/P, where A = Cross-sectional Area of Flow P = Wetted Perimeter
Problems in Hydrology • Extreme weather and rainfall variation • Streamflow and major flood devastation • River routing and hydraulic conditions • Overall water supply - local and global scales • Flow and hydraulics in pipes, streams and channels • Flood control and drought measures • Watershed management for urban development
Hurricane Ivan Sep 04 • Ivan spawned tornadoes from northern Florida into Georgia and Alabama with 22 deaths reported in Florida. • Waves as high as 50 feet were measured 75 miles south of Dauphin Island from 130-150 mph winds. • Ivan’s devastating march across the tropics after it formed was precisely predicted because a big ridge of high pressure steered it as predictably as rails carry a train • Created a potential disaster zone of more than 350 miles across.
Technology has Revolutionized the Field of Hydrology • High Speed Digital Computation • Geographical Information Systems (GIS) • Large Hydrologic and Meteorologic Databases • GPS and LIDAR methods for ground surveys • RADAR rainfall estimates from NEXRAD • Advanced forecasting tools for severe weather and flood Alert
RADAR Rainfall Estimates • NEXRAD provides real-time data on a ~16 km2 (6 mi2) grid • Equivalent to about 21 rain gages in Brays Bayou watershed • Each estimate represents an average rainfall amount over the entire 4 x 4 km2 area • NEXRAD rainfall estimates compare well with point rain gage measurements (r2 ~ 0.9)
FAS – NEXRAD Midnight 1 a.m.
Geographic Information Systems Digital data organized with spatial analysis tools from GIS Datasets linked to map locations
Hydrologic Theory • One of the principal objectives in hydrology is to transform rainfall that has fallen over a watershed area into flows to be expected in the receiving stream. • Losses must be considered such as infiltration or evaporation (long-term) • Watershed characteristics are important
Design Rainfalls • Design Storm from HCFCD and NWS • Based on Statistical Analysis of Data • 5, 10, 25, 50, 100 Year Events • Various Durations
A Note on Units • Rainfall volume is normally measured in inches or cm • Rainfall rate or intensity in inches/hr or cm/hr • Infiltration is measured in inches/hr or cm/hr • Evaporation is measured in inches or in/hr (cm/hr) • Streamflow is measured in cfs or m3/s • One acre-ft of volume is 43,560 ft3 of water • 1 ac-inch/hr is approx. equal to 1.008 cfs • Ground water flows are measured as ft3/day or m3/day
Unit Hydrograph Theory • The unit hydrograph represents the basin response to 1 inch (1 cm) of uniform net rainfall for a specified duration. • Linear method originally devised in 1932. • Works best for relatively small subareas - in the range of 1 to 10 sq miles. • Several computational methods exist.
Loss Rate Method:Initial & Uniform or Horton Method • Initial Amount Lost to Infiltration (in) Soil is Saturated. • Uniform Loss at a Constant Rate (in/hr) Inches/Hour Example: Initial Loss = 0.5 in, Uniform Loss = 0.05 in/hr
Unit Hydrograph Method • Snyder’s Method (1938) • Clark TC & R Method (1945) • Nash (1958) and Gray (1962) • SCS Method (1964) • Espey-Winslow (1968) • Instantaneous UH
Major Causes of Flooding(Excess Water that Inundates) • Highly Developed (urbanized) Area • Intensity and Duration of Rainfall • Flat Topography with Little Storage • Poor Building Practices in floodprone areas • No replacement of lost storage as area grows
Fannin at Holcombe Overpass - TS Allison 6/9/01 - 5:58 AM
Southwest Freeway (US 59) Detention storage between Mandell and Hazard Looking West Looking East