Download
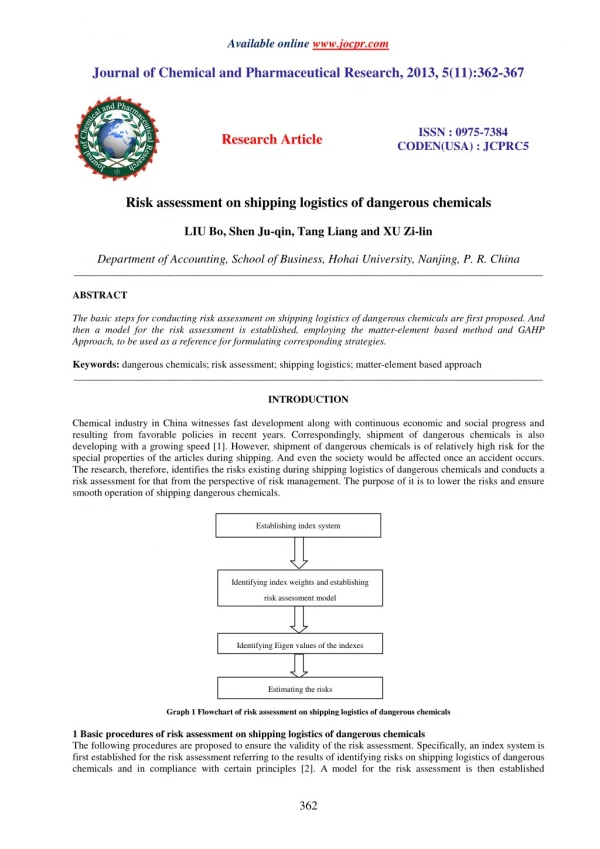
1 / 19
200 likes | 379 Vues
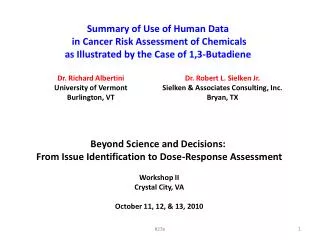
Environmental risk assessment of chemicals. Paul Howe Centre for Ecology & Hydrology, UK. Extrapolation from surrogate species to one species (humans) Identification of key endpoint Application of factors to account for specific types of uncertainty

E N D
Environmental risk assessment of chemicals Paul Howe Centre for Ecology & Hydrology, UK
Extrapolation from surrogate species to one species (humans) Identification of key endpoint Application of factors to account for specific types of uncertainty Precautionary – all individual humans are valued Foundation in human health risk assessment
For example …..Organotins Estimates of Tolerable Daily Intake for use in the risk assessment on the basis of medium-term exposure • Different key toxic endpoints for different organotins • Some have insufficient data to make an estimate • Uncertainty factors reflect the adequacy of the dataset
140,000 chemicals in European consumer products Starting point is prioritisation of effort Screening exercise In theory, we move from consideration of individual humans to populations of all other organisms With small datasets, this is difficult or impossible in practice Environmental risk assessment for chemicals
Guidance value always based on one study Highly dependent on uncertainty factor applied Unlikely to reflect true measure of risk at the population level for all organisms Small datasets and the use of uncertainty factors 100 10 1 Acute Chronic
Small datasets and the use of uncertainty factors 100 Base set: Uncertainty factor of 1000 applied to the red organism 10 1 PNEC = 0.0008 UF = 1000 Acute Chronic
Small datasets and the use of uncertainty factors 100 Base set plus chronic test on green organism: (not most sensitive) Uncertainty factor of 1000 applied to the red organism 10 1 PNEC = 0.0008 UF = 1000 Acute Chronic
Small datasets and the use of uncertainty factors 100 Base set plus chronic test on green and yellow organisms: Uncertainty factor of 100 applied to the red organism 10 1 PNEC = 0.008 UF = 100 Acute Chronic
Small datasets and the use of uncertainty factors 100 Base set plus chronic test on green, yellow and red organisms: Uncertainty factor of 10 applied to the red organism 10 1 PNEC = 0.02 UF = 10 Acute Chronic
Selection of key study Distinction between what is ‘acute’ and what is ‘chronic’ Selection of uncertainty factors Quality criteria against which studies are judged ‘Flexibility’ in the guidance documentation (not all aspects of study quality defined) Inclusion of factors outside the study (for example consideration of solubility/volatility of the substance) Variability in the deterministic approach
For nonylphenol ……. • 4 different key studies selected • 4 different uncertainty factors applied • …. From a dataset with 17 studies by a group of 6 ‘experts’ in risk assessment worldwide
Data rich chemicals • Probably <0.1% of all chemicals are data rich • Quality measures of individual studies are highly variable • Is it sensible to base a guidance value on only one study?
Data rich chemicals – deterministic approach • Lowest no-observed effect concentration • Uncertainty factor of 10 applied (even very data rich substances would have a UF applied) • Guidance value developed • Value below concentration required by some organisms (Cu is an essential element)
Probabilistic approach – copper • Uses all of the available data • Statistically derived value with error estimation • Transparent methodology with a defined protection target (95% of species) • In practice, very few chemicals have had guidance values derived this way • Few have sufficient data points to fit the distribution (often many of the data are acute rather than chronic tests) • Restrictive criteria for the use of the probabilistic approach (minimum number of species or taxonomic groups)
Guidance values for inorganic ions • It is only realistic to estimate relative hazard/risk as order of magnitude bands • Hazard or risk bands determine priorities; they are not accurate or precise risk values
Local PEC/PNEC ratios for the various uses of organotins Comparison with exposure to estimate risk
Conclusions • In theory, assessments have moved from consideration of individual humans to populations of all other organisms • With small datasets, this is difficult or impossible in practice • For the vast majority of chemicals a deterministic assessment is carried out • The deterministic methodology is a rather precautionary approach with multiple sources of variability • For the few data rich chemicals it is possible to use probabilistic methods and such methods tend to use most of the data • There need to be enough data points (including species & taxonomic groups) to fit the distribution
Whatever system is used it needs to be transparent Whether human health or environment, deterministic or probabilistic, the guidance value is compared with an environmental concentration to develop a risk ratio The subsequent ratio can be used to inform risk management With enough data it may be possible to subdivide the data into species sensitivity groupings which can be compared with field observations Conclusions