Acceptance Sampling plans
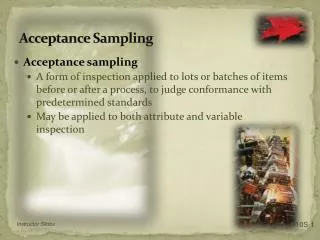
Acceptance Sampling plans. Prosedur pengambilan keputusan thdp produk yg datang atau sudah dihasilkan perusahaan Ada 3 metode : 1. Tanpa inspeksi 2. Inspeksi 100% 3. Sampel penerimaan (Acceptance Sampling). Konsep Dasar. Bukan alat pengendalian/teknik perbaikan kualitas


Acceptance Sampling plans
E N D
Presentation Transcript
Prosedur pengambilan keputusan thdp produk yg datang atau sudah dihasilkan perusahaan • Ada 3 metode : 1. Tanpa inspeksi 2. Inspeksi 100% 3. Sampel penerimaan (Acceptance Sampling) Konsep Dasar
Bukan alat pengendalian/teknik perbaikan kualitas • Sbg alat inspeksi bahan baku/produk sesuai dg spesifikasi atau tidak • Bentuk inspeksi antara prsh dg supplier, konsumen atau antar divisi dalam prsh • Dasar perkiraan keputusan penerimaan atau penolakan produk Acceptance Sampling
Pengujian destruktif • Biaya inspeksi tinggi • 100% inspeksi butuh waktu lama • Uji kinerja prsh thdp produk yg dihasilkan Alasan Penggunaan...
Lebih murah • Minimalkan kerusakan dan perpindahan tangan • Mengurangi kesalahan inspeksi • Memotivasi supplier bila ada penolakan bahan baku Keunggulan...
Resiko penerimaan produk “cacat” dan penolakan produk “baik” • Informasinya “sedikit” ttg produk • Butuh perencanaan dan dokumentasi prosedur pengambilan sampel Kelemahan...
1. The PRODUCER TEST • Sebelum produk dikirim ke konsumen 2. The CONSUMER TEST • Setelah produk dipakai oleh konsumen Macam pengujian...
NRC PGi Types of Acceptance sampling plan
NRC PGi Sampling by attributes concept n sampling Acceptance number c Reject lot Accept lot N Inspect & count number of defectives
NRC PGi Acceptance Sampling method
A Two-Stage Acceptance Sampling First Stage Inspect n1 items Find x1 defective items in this sample Yes Accept the lot x1<c1 ? No Yes Reject the lot x1>c2 ? Second Stage No Inspect n2 additional items Find x2 defective items in this sample Yes No x1 + x2<c3 ?
The Outcomes of Acceptance Sampling • Type I and Type II Errors State of the Lot H0 True Good-Quality Lot H0 False Poor-Quality Lot Decision AcceptH0 Accept the Lot Correct Decision Type II Error Accepting a Poor-quality lot Type I Error Rejecting a Good-quality lot Correct Decision RejectH0 Reject the Lot
NRC PGi Indeks Kualitas AS AQL (Acceptable Quality Level) Tipe I Error LQL (Limiting Quality Level) Tipe II Error IQL (Indifference Quality Level) AOQL (Average Outgoing Quality Level)
NRC PGi AQL (tipe I Error) Tingkat kualitas menurut produsen Proporsi maksimum dari kesalahan/cacat yg diperbolehkan Probabilitas penerimaan produsen 95-99% % maksimum ketidaksesuaian per 100 unit produk Resiko produsen (α) = resiko yg diterima produsen krn menolak produk BAIK Jika AQL kecil, Pa mendekati 1. Probabilitas kesalahan tipe I =α=1-Pa sekitar 0,05/0,01
NRC PGi LQL (Tipe II Error) LTPD (Lot Tolerance Percent Defective) Tingkat kualitas menurut konsumen Kualitas ketidakpuasan/tgk penolakan dg LQL rendah Resiko Konsumen (β) = resiko dialami konsumen krn terpaksa menerima produk CACAT / tidak sesuai β=probabilitas menerima produk cacat pd LQL Jika p (prob.menolak produk CACAT) besar, konsumen ingin Pa mendekati 0 (kecil biasanya 0,1)
NRC PGi IQL Tingkat kualitas antara AQL dan LQL Tingkat kualitas pd probabilitas penerimaan 0,5 untuk rencana sampel ttt Fokus pd supplier internal dan eksternal bhw produk yg diinspeksi diharapkan dpt memenuhi spesifikasi
NRC PGi AOQL Perkiraan hubungan bagian kesalahan produk sebelum inspeksi (INCOMING QUALITY) atau p dari bagian sisa kesalahan stlh inspeksi (OUTGOING QUALITY) AOQ = p x Pa Incoming Quality BAIK--> Outgoing Quality HRS BAIK Incoming Quality BURUK-->Outgoing Quality TETAP BAIK (asumsi tdk ada kesalahan selama inspeksi)
NRC PGi Evaluasi Kinerja Sampel Bermacam-macam pengukuran : 1. Kurva OC (Operating Characteristic) 2. Kurva AOQ (Average Outgoing Quality) 3. Kurva ATI (Average Total Inspection) 4. Kurva ASN (Average Sample Number)
NRC PGi OC Curve Kurva Karakteristik Operasi Kurva probabilitas penerimaan thdp produk yg dihasilkan Hubungan antara Pa dan p Rumus Pa = P(d ≤ c) Pa = probabilitas penerimaan c = cacat produk maksimum yg disyaratkan d = jumlah cacat yg terjadi p = bagian kesalahan dalam produk
Binomial Probability Function for Acceptance Sampling Probability of Accepting a Lot (Pa) where: n = sample size p = proportion of defective items in lot x = number of defective items in sample f(x) = probability of x defective items in sample
NRC PGi Pa = P (d ≤ c) Pa = ∑ n! Pd (1-p) n-d d! (n-d)! Nilai Pa terlihat pada Tabel DISTRIBUSI BINOMIAL
NRC PGi Operating Curves
NRC PGi 100 95 75 50 25 10 0 = 0.05 producer’s risk for AQL Probability of Acceptance = 0.10 Percent Defective Consumer’s risk for LTPD 0 1 2 3 4 5 6 7 8 AQL LTPD Good lots Bad lots Indifference zone
NRC PGi OC Curves for Different Sampling Plans P(Accept Whole Shipment) n = 50, c = 1 100% n = 100, c = 2 0% 0 1 2 3 4 5 6 7 8 9 10 AQL LTPD % Defective in Lot
NRC PGi AOQ Curve Mengukur rata-rata tgk kualitas output dr hasil produksi yg banyak dg proporsi kerusakan p N - byknya unit yg dihasilkan n - unit sampel yg diinspeksi p - bagian kesalahan/kerusakan = p Pa – probabilitas penerimaan = Pd
NRC PGi Contoh ...Single Sampling
NRC PGi Secara MATEMATIS Pa = P (d ≤ c) Pa = ∑ n! Pd (1-p) n-d d! (n-d)! Maka P (d ≤ 2 ) = P (d =0,1,2) = P(d=0)+P(d=1)+P(d=2) = 0,544 Asumsi p = 0,05 P(d=0) = 50! (0,05)0(1-0,05) (50-0) = 0! (50-0)! P(d=1) = 50! (0,05)1(1-0,05) (50-1) = 1! (50-1)! P(d=2) = 50! (0,05)2(1-0,05) (50-2) = 2! (50-2)!
Example: Acceptance Sampling An inspector takes a sample of 20 items from a lot. His policy is to accept a lot if no more than 2 defective items are found in the sample. Assuming that 5 percent of a lot is defective, what is the probability that he will accept a lot? Reject a lot?
NRC PGi • Secara TABELARIS • np = (20)(0,05) = 1 Pa = .920
Example: Acceptance Sampling n = 20, c = 2, and p = 5% (.05) P(Accept Lot) = f(0) + f(1) + f(2) P(Accept Lot) = .3585 + .3774 + .1887 = .9246
Example: Acceptance Sampling n = 20, c = 2, and p = .05 P(Reject Lot) = 1 – P(Accept Lot) = 1 - .9246 = .0754
NRC PGi Double-sampling plans Contoh : n1= 50 c1 = 1 n2 = 100 c2 = 3
NRC PGi Secara TABELARISP` = 0,01--> n1p` = 0,5 n2p` = 1,0
NRC PGi P` = 0,02--> n1p` = 1,0 n2p` = 1,5
NRC PGi P` = 0,06--> n1p` = 3,0 n2p` = 6,0
NRC PGi P =0,08 n1p = 50.0,08 = 4,0 n2p = 100.0,08= 8,0
NRC PGi • Single Sampling dg N = 5000 n =40 c =4 ( asumsi p = 0,01 ; 0,05 ; 0,6 scr matematis dan tabel) • Double Sampling dg N = 5000 n1 = 40 c 1 = 1 n2 = 60 c2 = 5 dg p = 0,01 ; 0,04 ; 0,6 scr tabel