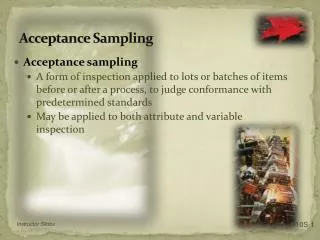
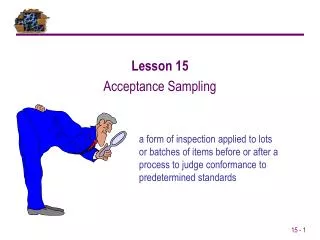
Acceptance Sampling
Chapter 4 Supplement. Acceptance Sampling. Beni Asllani University of Tennessee at Chattanooga. Operations Management - 5 th Edition. Roberta Russell & Bernard W. Taylor, III. Lecture Outline. Single-Sample Attribute Plan Operating Characteristic Curve

Acceptance Sampling
E N D
Presentation Transcript
Chapter 4 Supplement Acceptance Sampling Beni AsllaniUniversity of Tennessee at Chattanooga Operations Management - 5th Edition Roberta Russell & Bernard W. Taylor, III Copyright 2006 John Wiley & Sons, Inc.
Lecture Outline • Single-Sample Attribute Plan • Operating Characteristic Curve • Developing a Sampling Plan with Excel • Average Outgoing Quality • Double - and Multiple-Sampling Plans Copyright 2006 John Wiley & Sons, Inc.
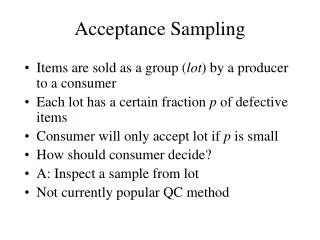
Acceptance Sampling • Accepting or rejecting a production lot based on the number of defects in a sample • Not consistent with TQM or Zero Defects philosophy • producer and customer agree on the number of acceptable defects • a means of identifying not preventing poor quality • percent of defective parts versus PPM Copyright 2006 John Wiley & Sons, Inc.
Single–Sample Attribute Plan • Single sampling plan • N = lot size • n = sample size (random) • c = acceptance number • d = number of defective items in sample • If d ≤ c, accept lot; else reject Copyright 2006 John Wiley & Sons, Inc.
AQL or acceptable quality level proportion defect the customer will accept a given lot LTPD or lot tolerance percent defective limit on the number of defectives the customer will accept or producer’s risk probability of rejecting a good lot β or consumer’s risk probability of accepting a bad lot Producer’s and Consumer’s Risk Copyright 2006 John Wiley & Sons, Inc.
Accept Reject Type I Error Producer’ Risk Good Lot No Error Type II Error Consumer’s Risk Bad Lot No Error Sampling Errors Producer’s and Consumer’s Risk (cont.) Copyright 2006 John Wiley & Sons, Inc.
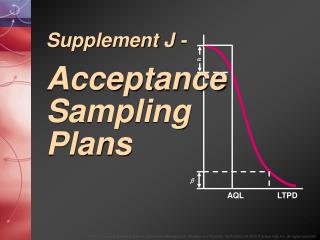
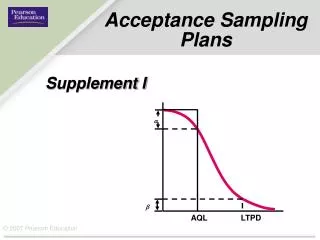
Operating Characteristic (OC) Curve • shows probability of accepting lots of different quality levels for a specific sampling plan • assists management to discriminate between good and bad lots • exact shape and location of the curve is defined by the sample size (n) and acceptance level (c) for the sampling plan Copyright 2006 John Wiley & Sons, Inc.
1.00 – 0.80 – 0.60 – 0.40 – 0.20 – – = 0.05 OC curve for n and c Probability of acceptance, Pa = 0.10 | 0.02 | 0.04 | 0.06 | 0.08 | 0.10 | 0.12 | 0.14 | 0.16 | 0.18 | 0.20 Proportion defective AQL LTPD OC Curve (cont.) Copyright 2006 John Wiley & Sons, Inc.
Developing a Sampling Plan with Excel ABC Company produces mugs in lots of 10,000. Performance measures for quality of mugs sent to stores call for a producer’s risk of 0.05 with an AQL of 1% defective and a consumer’s risk of 0.10 with a LTPD of 5% defective. What size sample and what acceptance number should ABC use to achieve performance measures called for in the sampling plan? N = 10,000 n = ? α = 0.05 c = ? β = 0.10 AQL = 1% LTPD = 5% Copyright 2006 John Wiley & Sons, Inc.
Sampling Plan and OC Curve Input Use Poisson distribution function to calculate PAs Use chart wizard to graph OC Use Solver to find values for n and c Copyright 2006 John Wiley & Sons, Inc.
Average Outgoing Quality (AOQ) • Expected number of defective items that will pass on to customer with a sampling plan • Average outgoing quality limit (AOQL) • maximum point on the curve • worst level of outgoing quality Copyright 2006 John Wiley & Sons, Inc.
AOQ Curve AOQL 1.39% Copyright 2006 John Wiley & Sons, Inc.
Double Sampling Plans • Take small initial sample • If # defective < lower limit, accept • If # defective > upper limit, reject • If # defective between limits, take second sample • Accept or reject based on 2 samples • Less costly than single-sampling plans Copyright 2006 John Wiley & Sons, Inc.
Multiple Sampling Plans • Uses smaller sample sizes • Take initial sample • If # defective < lower limit, accept • If # defective > upper limit, reject • If # defective between limits, resample • Continue sampling until accept or reject lot based on all sample data Copyright 2006 John Wiley & Sons, Inc.
Copyright 2006 John Wiley & Sons, Inc.All rights reserved. Reproduction or translation of this work beyond that permitted in section 117 of the 1976 United States Copyright Act without express permission of the copyright owner is unlawful. Request for further information should be addressed to the Permission Department, John Wiley & Sons, Inc. The purchaser may make back-up copies for his/her own use only and not for distribution or resale. The Publisher assumes no responsibility for errors, omissions, or damages caused by the use of these programs or from the use of the information herein. Copyright 2006 John Wiley & Sons, Inc.