ACCEPTANCE SAMPLING
ACCEPTANCE SAMPLING. BPT2423 – STATISTICAL PROCESS CONTROL. CHAPTER OUTLINE. Fundamental Concepts Types of Sampling Plans Single, Double, Multiple and Sequential Statistical Aspects Lot-By-Lot Acceptance Sampling Plans for Attributes Acceptance Sampling Plans For :


ACCEPTANCE SAMPLING
E N D
Presentation Transcript
ACCEPTANCE SAMPLING BPT2423 – STATISTICAL PROCESS CONTROL
CHAPTER OUTLINE • Fundamental Concepts • Types of Sampling Plans • Single, Double, Multiple and Sequential • Statistical Aspects • Lot-By-Lot Acceptance Sampling Plans for Attributes • Acceptance Sampling Plans For : • Continuous Production • Variables
LESSON OUTCOMES • Know the advantages and disadvantages of sampling • Understand the types of sampling plans and selection factors • Determine the Operation Characteristic (OC) curve for a single sampling plan and the properties
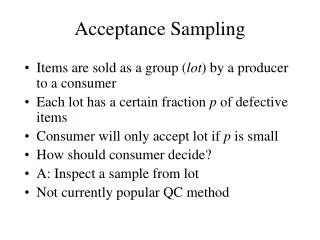
FUNDAMENTAL CONCEPT • Lot-by-lot acceptance sampling by attributes is the most common type of sampling • A predetermined number of units (sample) from each lot is inspected by attributes • If the number of nonconforming units is less than the prescribed minimum, the lot is accepted;if not, the lot is not accepted • Acceptance sampling can be used either for the number of nonconforming units or for nonconformities per unit • Example : • Lot size, N = 9000 • Sample size, n = 300 • Acceptance number, c = 2
FUNDAMENTAL CONCEPT Acceptance sampling is most likely to be used in one of five situations: • When the test is destructive, sampling is necessary; otherwise, all of the units will be destroyed by testing • When the cost of 100% inspection is high in relation to the cost of passing a nonconforming unit • When there are many similar units to be inspected; with manual inspection, fatigue and boredom cause a higher percentage of nonconforming material to be passed than would occur on the average using a sampling plan • When information concerning producer’s quality, such as X-Bar and R, p or c charts and Cpkis not available • When automated inspection is not available
FUNDAMENTAL CONCEPT • More economical (fewer inspectors and less handling) • Upgrades the inspection job (piece-by-piece to lot-by-lot) • Applies to destructive testing • Stronger motivation for improvement (entire lots are not accepted rather than the return of a few nonconforming units) • Certain risks of not accepting conforming lots and accepting non-conforming lots • More time and effort is devoted to planning and documentation • Less information is provided about the product • There is no assurance that the entire lot conforms to specifications Advantages Disadvantages
FUNDAMENTAL CONCEPT • Lot Formation can influence the effectiveness of the sampling plan: • Lots should be homogeneous • Lots should be as large as possible • The sample units selected for inspection should be representative of the entire lot – random sampling • There are a number of courses of action that can be taken on the non-accepted lots: • Passed to the production facilities and the non-conforming units sorted by production personnel • Rectified at the consumer’s plant by personnel from either the producer’s or the consumer’s plant • Returned to the producer for rectification
TYPES OF SAMPLING PLANS • Single – one sample is taken from the lot and a decision to accept or not accept the lot is made based on the inspection results of that sample • Double – on the initial sample, a decision, based on the inspection results, is made whether: • To accept the lot • Not to accept the lot • To take another sample • If the quality is very good, the lot is accepted on the first sample and a second sample is not taken; if the quality is very poor, the lot is not accepted on the first sample and a second sample is not taken • Only when the quality level is neither very good nor very bad is a second sample taken
TYPES OF SAMPLING PLANS • Multiple – is a continuation of double sampling in that three, four, five or as many samples as desired can be established. Sample sizes are much smaller • Sequential – items are sampled and inspected one after another. A cumulative record is maintained and a decision is made to accept or not accept the lot as soon as there is sufficient cumulative evidence Remarks: • All four types of sampling plans can give the same results. Thus, the type of plan for a particular unit is based on factors other than effectiveness • These factor are simplicity, administrative costs, quality information, number of units inspected and psychological impact
STATISTICAL ASPECTS Operation Characteristic (OC) Curve for Single Sampling Plans • In judging a particular sampling plan, it is desirable to know the probability that a lot submitted with a certain percent nonconforming, 100po , will be accepted – the OC curve will provide this information • When the percent nonconforming is low, the probability of the lot being accepted is large and decreases as the percent nonconforming increases • In graphing the curve with the variables 100Pa (percent of lots accepted) and 100po (percent nonconforming), one value, 100po , will be assumed and the other calculated
STATISTICAL ASPECTS Construction of an OC Curve • Assume po value • Calculate npo value • Attain Pa values from the Poisson table using the applicable c and npo values • Plot point (100po , 100Pa) • Repeat 1,2,3 and 4 until a smooth curve is obtained OC Curve for the Single Sampling Plan
STATISTICAL ASPECTS Calculation:
STATISTICAL ASPECTS OC Curve Properties • Acceptance sampling plans with similar properties can give different Operation Characteristic (OC) curve: Sample size as a fixed percentage of lot size Fixed sample size
STATISTICAL ASPECTS OC Curve Properties (cont.) As sample size increase, the curve becomes steeper As the acceptance number decrease, the curve becomes steeper
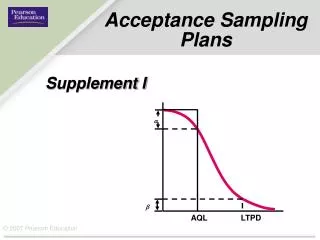
STATISTICAL ASPECTS Consumer-Producer Relationship • There is a conflicting interest between the consumer and the producer when using acceptance sampling • Ideal OC curve that is a vertical line can satisfy both – can be achieved only with 100% inspection • Sampling carries risks of not accepting lots that are acceptable and of accepting lots that are unacceptable • Acceptance Quality Limit (AQL) “Is the quality level that is the worst tolerable process average when a continuing series of lots is submitted for acceptance sampling. It is a reference point on the OC curve and is not meant to convey to the producer that any percent nonconforming is acceptable. It is a statistical term and is not meant to be used by the general public”
STATISTICAL ASPECTS Consumer-Producer Relationship (cont.) • Producer’s Risk • Represented by the symbol α, is the probability of non acceptance of a conforming lot • This risk is frequently given as 0.05, but it can range from 0.001 to 0.10 or more • It cannot be located on an OC curve unless specified in terms of the probability of acceptance • This conversion is accomplished by subtracting from 1 • Thus, Pa = 1 – α and for α = 0.05, Pa = 0.95
STATISTICAL ASPECTS Consumer-Producer Relationship (cont.) • Limiting Quality (LQ) “Is the percent nonconforming in a lot or batch for which, for acceptance sampling purposes, the consumer wishes the probability of acceptance to be low” • Consumer’s Risk • Represented by the symbol β, is the probability of acceptance of a nonconforming lot • This risk is frequently given as 0.10
STATISTICAL ASPECTS Example: AQL = 0.7% • There are 0.7% nonconforming will have a non-acceptance probability of 5% or in other words; 1 out of 20 lots that are 0.7% nonconforming will not be accepted by the sampling plan LQ = 2.6% • There are 2.6% nonconforming will have a 10% chance of being accepted or in other words; 1 out of 10 lots that are 2.6% nonconforming will be accepted by this sampling plan Consumer-Producer Relationship (cont.)
ACCEPTANCE SAMPLING PLANS Attributes • Was first devised in 1942 by a group of engineers at Bell Telephone Laboratories for use by the US government • It was designated JAN-STD-105 and adopted by the ISO and designated ISO/DIS-2859 • Have been revised 5 times (MIL-STD-105E) and modified by American Society for Quality (ASQ) under the designation ANSI/ASQ Z1.4 – all tables and procedures remain unchanged
ACCEPTANCE SAMPLING PLANS Attributes (cont.)
ACCEPTANCE SAMPLING PLANS Continuous Production
ACCEPTANCE SAMPLING PLANS Variables