
Uploaded by
shellie-peterson
1 SLIDES
97 VUES
10LIKES
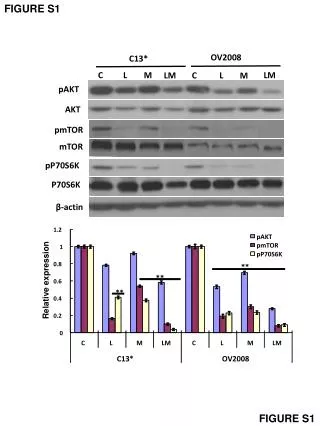
Comparative Analysis of pAKT, pmTOR, and pP70S6K Expression Levels in Ovarian Cancer Cells
DESCRIPTION
This figure depicts the relative expression levels of pAKT, pmTOR, and pP70S6K proteins in ovarian cancer cells, highlighting potential targets for future therapeutic interventions.
Download
1 / 1
Télécharger la présentation 
Comparative Analysis of pAKT, pmTOR, and pP70S6K Expression Levels in Ovarian Cancer Cells
An Image/Link below is provided (as is) to download presentation
Download Policy: Content on the Website is provided to you AS IS for your information and personal use and may not be sold / licensed / shared on other websites without getting consent from its author.
Content is provided to you AS IS for your information and personal use only.
Download presentation by click this link.
While downloading, if for some reason you are not able to download a presentation, the publisher may have deleted the file from their server.
During download, if you can't get a presentation, the file might be deleted by the publisher.
E N D
Presentation Transcript
FIGURE S1 1.2 pAKT pmTOR 1 pP70S6K 0.8 ** ** 0.6 ** 0.4 0.2 0 C L M LM C L M LM C13* OV2008 OV2008 C13* C L M LM LM C L M pAKT AKT pmTOR mTOR pP70S6K P70S6K β-actin Relative expression FIGURE S1


More Related