Download
1 / 79
790 likes | 891 Vues
Exploring projected unit costs of conventional fossil fuels, hidden externality costs, and the advantages of shifting to renewable energy sources in NYS. Discusses how transitioning can reduce air pollution, create jobs, stabilize energy prices, and decrease mortality rates. Provides insights on the renewable energy trend and regulations' enforcement impact. A dispassionate view of the fossil fuel industry's priorities and risks to public health in high-volume fracking operations.

E N D
Projected Unit Costs of Selected Conventional Fossil Fuels Over the Period 2009-2030 in NYS. Source: NYSEPB (2009), Energy Price and Demand Long-Term Forecast (2009-2028). Annual growth rate factors provided in reference document have been extrapolated for the period 2029-2030.
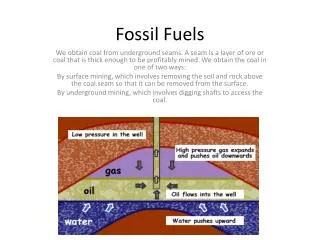
Externality Costs for Fossil Fuel Generation The hidden costs of: Air pollution morbidity and mortality Water pollution costs Global warming damage. e.g. coastline loss, agricultural and fish losses, human heat stress mortality, increases in severe weather and air pollution Worker health
Approximate fully annualized generation and short-distance transmission costs for WWS and new conventional power (2007 U.S. cents/kWh-delivered), including externality costs.
NO to HVHF, YES to a Much Better Plan The plan would: Reduce NYS’s end-use power demand ~37%. Stabilize energy prices since fuel costs would be zero. Create more jobs than lost because nearly all NYS energy would now be produced in-state, ~58,000 new, permanent, full-time jobs by 2025. Reduce NYS air pollution mortality and its costs by ~4000/yr, and ~$33 billion/yr (3% of 2010 NYS GDP), respectively, repaying the 271 GW installed power needed within ~17 y. NYS’s own emission decreases would reduce 2050 U.S. climate costs by ~$3.2 billion/yr.
100% of electric capacity added in U.S. last month was renewable The Federal Energy Regulatory Commission, the agency that announced that almost half of all new electricity generating capacity added in the U.S. in 2012 was renewable, has released its data for the month of January. http://www.ferc.gov/legal/staff-reports/2013/jan-energy-infrastructure.pdf
The Industry/Regulator/Legislator Merry-go-Round Former Pa. counsel to handle Range's legislative, regulatory affairs Feb 21, 2013 - Range Resources Corp. has selected Terry Bossert as vice president of legislative and regulatory affairs for its Appalachia division, the company announced yesterday. Bossert is the former senior vice president of regulatory and government affairs for Chief Oil & Gas LLC and ex-counsel to the Pennsylvania Department of Environmental Protection. He will report to Scott Roy, former deputy chief of staff to Pennsylvania Gov. Ed Rendell (D), who left office in 2009.
Regulations Without Strict Enforcement Are Just Words on Paper Feb 22, 2013 - In the third day of budget hearings Thursday, …Sen. Jim Ferlo, D-38, voiced surprise that nine of every 10 violations cited by DEP inspectors at Marcellus Shale gas wells in 2011 resulted in no fines. “How do you reconcile that?” the Pittsburgh lawmaker asked. “The idea of an issuance of a notice of violation is not to issue a fine. The idea is to bring conduct which is potentially volatile to the attention of the operator so the operator can do something about it,” Krancer said. But that wasn’t enough for Ferlo, who is a member of the Senate Environmental Resources & Energy Committee. “You’re the secretary of DEP and the citizens are demanding that there be proper enforcement and proper citations to correct the behavior of an industry that, in my opinion, has run amok, despite your perception of the industry. Citizens feel very shortchanged right now,” Ferlo said. “I’m sorry for that perception on your part. I think it’s an incorrect perception,” Krancer responded. http://www.phillyburbs.com/news/local/courier_times_news/dep-secretary-krancer-hit-on-marcellus-shale-smallmouth-bass/article_446821c4-2d21-55d3-a497-d995674c994a.html
A Dispassionate View of the Industry. “…oil and gas companies are not in business to steward the environment, save the family farm or pull depressed areas out of economic decline. If these things should by chance happen, they are merely peripheral to the primary mission of the companies and certainly were never considered in corporate exploration and production plans. Further, given shales’ steep declines and thus limited lives, such benefits will be short-lived as well. It would be the height of naïveté to assume that such companies have altruistic intent towards a region or its residents. They do not. Oil and gas companies are in business to extract hydrocarbons as cheaply and efficiently as possible and get them to the customer that will pay the highest price. If they can shave dollars off already thin margins by refusing to use pollution control devices then that is precisely what they will do if it is not mandated, regardless of whether this will increase costs for a region due to pollution or negatively impact other industries. Even though pollution and degradation involve real costs, they are not borne by the industry that perpetrates them in today's economic accounting. This is especially true of the oil and gas industry as they are exempt from federal environmental protection statutes.” Rodgers, Energy Policy Forum, February 2103
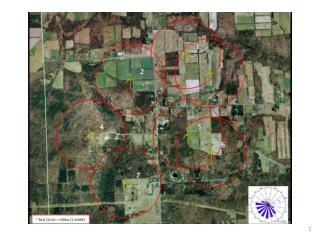
Why Is High-Volume Fracing from Long Laterals in Shales a Higher Risk to Public Health? Requires much higher well density, many wells per square mile. Requires much more industrial development over large areas, heavy equipment operating 24/7/365. Requires much higher volumes of fracing fluid, millions of gallons per well. Produces much higher volumes of waste fluids and solids containing hazardous materials: frac fluid chemicals, heavy metals, NORMS, NOx, VOC’s. Produces higher volumes of fugitive emissions of methane.
Why Is Slickwater, High-Volume Fracing from Long Laterals a Higher Risk to Public Health? As number of wells and volumes of waste increase, probability of accidental releases of hazardous materials into air and groundwater increases. Cumulative effects on air and water and health from these and from purposeful emissions into the atmosphere and releases into groundwater are unknown. Increased production, processing, storage, transportation and burning of natural gas and its liquid companions (e.g. ethane, propane, butane) increases emission of GHG’s, exacerbates climate change
GOOD MECHANICAL INTEGRITY CONDUCTOR PIPE FRESH WATER AQUIFER ZONE SURFACE CASING PRODUCTION CASING SHALLOW PRODUCING ZONE INTERMEDIATE PRODUCING ZONE TARGET PRODUCING ZONE
CEMENT CHANNELING CONDUCTOR PIPE PRESSURE BUILDS UP FRESH WATER AQUIFER ZONE SURFACE CASING PRODUCTION CASING FORMATION SHALLOW PRODUCING ZONE CASING CEMENT INTERMEDIATE PRODUCING ZONE TARGET PRODUCING ZONE
LEAK THROUGH CASING CONDUCTOR PIPE PRESSURE BUILDS UP FRESH WATER AQUIFER ZONE SURFACE CASING PRODUCTION CASING FORMATION CASING SHALLOW PRODUCING ZONE INTERMEDIATE PRODUCING ZONE TARGET PRODUCING ZONE
INSUFFICIENT CEMENT COVERAGE CONDUCTOR PIPE PRESSURE BUILDS UP FRESH WATER AQUIFER ZONE SURFACE CASING PRODUCTION CASING SHALLOW PRODUCING ZONE INTERMEDIATE PRODUCING ZONE TARGET PRODUCING ZONE
Surface Impacts on Health/Environmental: Pads, Pipelines. Impoundments, Flares Photo Courtesy of Bob Donnan
Surface Impacts on Health/Environmental: Pads and Pipelines …and these will be located wherever permission is given Photo Courtesy of Bob Donnan
Surface Impacts on Health/Environmental: Pads, Pipelines. Impoundments Photo Courtesy of Bob Donnan
Surface Impacts on Health/Environmental: Waste Impoundments Are needed even with “recycling” Photos Courtesy of Bob Donnan CARTER IMPOUNDMENT, PA Marcellus
Surface Impacts on Health/Environmental: Pipelines and Compressor Stations Buffalo, Pa, Compressor Station Photo Courtesy of Bob Donnan
Observation: What Does This All Look Like “Downhole”? • Laboratory-Scale Experiment: • A Block of Real Rock • Apply earth-like pressure to all 6 sides • Drill It, Right Down the Middle • Case It • Cement It • Perforate it • Frac It, with Red Dye in the Frac Fluid • Break Open the Block • See What Happened
Nobel Winner F. Sherwood Rowland: On The Responsibility of Scientists “Is it enough for a scientist simply to publish a paper? Isn’t it a responsibility of scientists, if you believe that you have found something that can affect the environment, isn’t it your responsibility to actually do something about it, enough so that action actually takes place?” “If not us, who? If not now, when?” Rowland, at a White House climate change roundtable in 1997. http://thinkprogress.org/romm/2012/03/12/442296/sherry-rowland-sounded-alarm-ozone-layer/#more-442296
Key Data for Estimation of Well Productivity and Economics: PA From: Chesapeake Energy (CHK) published pro forma data
Blowout Through Nearby, Unknown, Abandoned Well MYTH: You should not worry about mistakenly stimulating an abandoned well. ➣ "There are approximately 4,000 abandoned or unreported wells on DEC's priority plugging list." ➣ "There are approximately 35,000 wells for which DEC has no records.“ NYS DEC, October 5, 2011 Pearsall, Texas November, 2010
MYTH: Fracs in shales stay in shale ~1500 ft ~1800 ft Thickness of shale layer: 100-300 ft
Difficult to Keep Un-Natural Fractures “In Pay Zone” Hydrofracture Intersects Existing Fault Base Image Courtesy of Southwestern Energy
PA DEP Waste Production Database:38 % of Frac Fluid Recycled in 2011 Industry claims of “nearly 100% recycling” are not supported by DEP data
New Scientific Data on Methane Contamination of Water Wells www.pnas.org/cgi/doi/10.1073/pnas.1100682108
The “New” Intermediate Casing Myth Additional Well Casing to Prevent Gas Migration: In most cases, an additional third, cemented well casing is required around each well to prevent the migration of gas. The three required casings are the surface casing, the new intermediate casing and the production casing. The depths of both surface and intermediate casings will be determined by site-specific conditions.
As-Built Casing Layouts for 2 PA Marcellus Wells That Contaminated Water Wells
Natural Gas Price is Volatile $3.96 Today
MIT Study On Economics of Shale Gas $3.96 Today Jacoby et al., Economics of Energy & Environmental Policy, Vol. 1, No. 1, pp. 37-51, 2011
MIT Study on Economics of Shale Gas Wells Jacoby et al., Economics of Energy & Environmental Policy, Vol. 1, No. 1, pp. 37-51, 2011
Comparison of Modeling Assumptions and Key Results Time scale GWP heat/ Methane Methane (years) electricity from gas from coal (gC/MJ) (gC/MJ)Howarth et al. 20 / 100 33 / 105 both 0.56 – 1.3 0.045 – 0.14 Hughes 20 / 100 33 / 105 both 0.56 – 1.3 0.045 – 0.14 Skone 100 25 electr. 0.34 0.17Jiang et al. 100 25 electr. 0.40 Not reportedWorldwatch 100 25 electr. 0.34 0.094Wigley 0 – 200 n/a electr. 0.34 – 1.4 0.107 U.S. EPA (2011) n/a n/a n/a 0.75 0.04
Many Reports/Papers Since April, 2011 1. Howarth R W, Santoro R, Ingraffea A. Clim. Change 106, 679–690 (2011).* 2. Skone T. http://cce.cornell.edu/EnergyClimateChange/NaturalGasDev/Documents/PDFs/SKONE_NG_LC_GHG_Profile_Cornell_12MAY11_Final.pdf 3. Hughes D. Post Carbon Institute, 2011; http://go.nature.com/gkboqm 4. Osborn S G et al. Proc. Natl Acad. Sci. USA, 108, 8172–8176 (2011). * 5. Kumar S. WorldWatch Institute, http://www.worldwatch.org/despite-methane-emissions-upstream-natural-gas-cleaner-coal-life-cycle-basi.s 5. JiangM et al. Environ. Res. Lett. 6: 034014 (2011).* 6. Wigley T. Clim. Change (2011). DOI 10.1007/s10584-011-0217-3.* 7. Hultman N et al. (2011). Environ. Res. Lett. 6: 044008,doi:10.1088/1748-9326/6/4/044008* 8. Cathles LM et al. Clim. Change (2012) DOI 10.1007/s10584-011-0333-0. * 9. Howarth R W, Santoro R, Ingraffea A. Clim. Change, In press, 2012. * * = Peer Reviewed
The Cathleset al. Paper: Our Cornell Colleagues’ Criticisms of Our 1st Paper • a physical argument that large flows of gas are not possible while frac fluids fill the well; • 2) an assertion that venting of methane to the atmosphere would be unsafe; • 3) a statement that we incorrectly used data on methane capture during flowback to estimate venting; • 4) an assertion that venting of methane is not in the economic interests of industry.
Our 2nd Paper Refutes These Arguments, And Provides New Supporting Data 1) a physical argument that large flows of gas are not possible while frac fluids fill the well. Large flows do occur because flowback is two-phase, not dissolved gas; and there is 10 to 100 times more flowback from shale wells than from conventional wells.
Our 2nd Paper Refutes These Arguments, And Provides New Supporting Data 2) an assertion that venting of methane to the atmosphere would be unsafe. EPA (2011) reports 85% of flowback gas from unconventional wells is vented, less than 15% flared or captured; methane density only 58% that of air and is extremely buoyant when vented (recall video); venting is NOT illegal:“excess gas encountered during drilling, completion or stimulation shall be flared, captured, or diverted away from the drilling rig in a manner than does not create a hazard to the public health or safety”
Our 2nd Paper Refutes These Arguments, And Provides New Supporting Data 3) a statement that we incorrectly used data on methane capture during flowback to estimate venting. We used data on captured gas as a surrogate for vented emissions, similar to EPA (2010) because industry does not measure or estimate the gas that is vented during flowback. Most data we used were reported to the EPA as part of their “green completions” program, and they provide some of the very few publicly available quantitative estimates of methane flows at the time of flowback. (Note new EPA regulations start in 2012).
Our 2nd Paper Refutes These Arguments, And Provides New Supporting Data 4) an assertion that venting of methane is not in the economic interests of industry. According to EPA (2011b), break-even price at which the cost of capturing flowback gas equals market value of captured gas is slightly under $4/Mcf. See next slide.
Comparison of Modeling Assumptions and Key Results Time scale GWP heat/ Methane Methane (years) electricity from gas from coal (gC/MJ) (gC/MJ)Howarth et al. 20 / 100 33 / 105 both 0.56 – 1.3 0.045 – 0.14 Hughes 20 / 100 33 / 105 both 0.56 – 1.3 0.045 – 0.14 Skone 100 25 electr. 0.34 0.17Jiang et al. 100 25 electr. 0.40 Not reportedWorldwatch 100 25 electr. 0.34 0.094Wigley 0 – 200 n/a electr. 0.34 – 1.4 0.107 U.S. EPA (2011) n/a n/a n/a 0.75 0.04