
Data Organization and Frequency Distributions Guide
E N D
Presentation Transcript
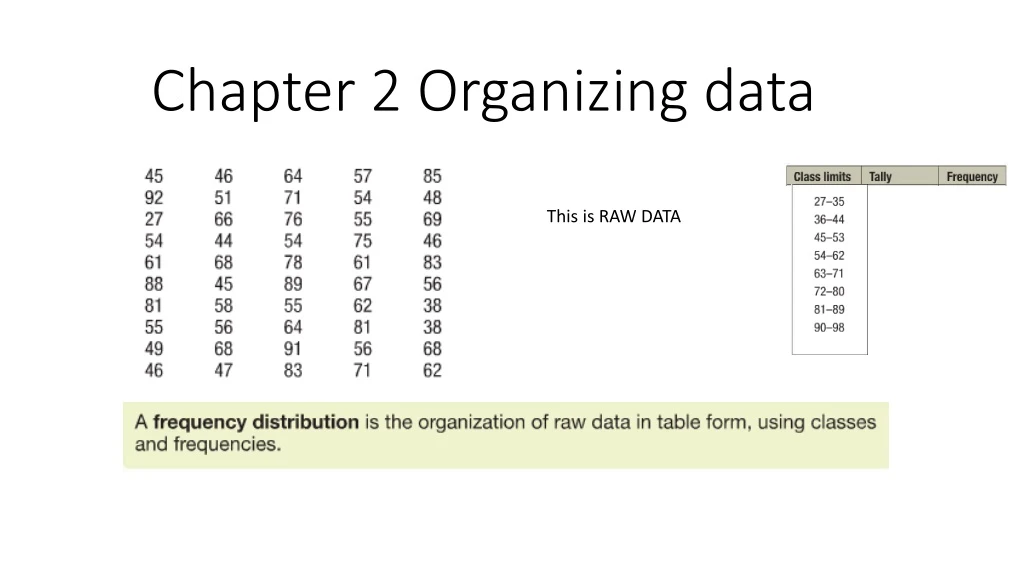
Chapter 2 Organizing data This is RAW DATA
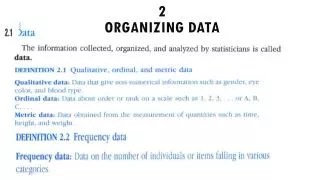
Three types of Frequency distributions: • Categorical Frequency distributions (Qualitative) • Grouped Frequency distributions (Quantitative with large spread) • Ungrouped frequency distributions(Quantitative with small spread) • ******for ungrouped the interval width is = 1. **********
Rules for a grouped frequency distribution • 1. There should be between 5 and 20 classes • 2. Preferable for class width to be an odd number • 3. classes must be mutually exclusive • 4. Classes must be continuous • 5. Classes must be exhaustive • 6. Classes must be equal in width ***Class width (interval width) = (Max – Min)/ number of classes***
Cumulative distribution (will be given by megastat) • --is a distribution that shows the number of data values less than or equal to specific value (usually an upper boundary)
Work with a partner and do the following: age 5214, 15, 19 HW: Page 51 1-8,
Charts and graphs • Histograms • Frequency polygons • ogives
Relative frequency graphs • The y axis is proportion rather than frequencies. (percentages)
Other types of graphs Bar graph Pareto chart Time series Pie graph Dot plot Stem and leaf plot Box and whiskers
Homework • Page 101-103 1-26 all • Chapter 2 quiz next class—using homework, notes and megastat.