Linear Law
Linear Law. “Transformation” of non-linear relationships to linear relationships. How it works. Quadratic Curve: non-linear!. Graph of y vs x. y. 3. x 2. Transforming to linear relationship. Linear ?. General equation of linear relationship:. Plot y vs x 2. y. 3. 1/x. Plot y vs.

Linear Law
E N D
Presentation Transcript
Linear Law “Transformation” of non-linear relationships to linear relationships
How it works Quadratic Curve: non-linear! Graph of y vs x
y 3 x2 Transforming to linear relationship Linear ? General equation of linear relationship: Plot y vs x2
y 3 1/x
Plot y vs Plot xy vs x Grad = b, y-intercept = a Grad = a, y-intercept = b
Plot lg y vs x m = lg b, c = lg a + 3 lg b
Plot lg (y – 4) vs x m = lg b, c = lg a
Q1a Plot (1/y) vs x2 m = a, c = b
Q1b Plot xy vs x2 m = a, c = b
Q1c Plot xy vs m = b, c = a
Q1d Plot lg y vs x m = lg b, c = lg a
Q1e Plot lg y vs lg x m = b, c = - lg a
Q1f Plot vs x m = p, c = - q
a) y x2 (4,9) (0,1) Express y in terms of x? y = ??x
b) (0,2) (4,0) Express y in terms of x?
Q2a lg y (5, 9) (2, 3) x + 1
Q2b lny Q (3, 9) P (1, 3) ln (x – 1)
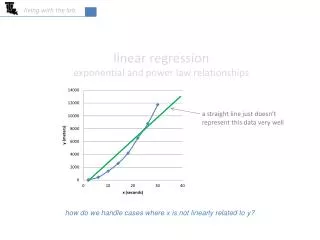
The following table gives values of y corresponding to some value of x. It is known that x and y are related by the equation • . • Explain how a straight-line graph of against can be drawn to represent the given equation and draw it for the given data. Use this graph to estimate the value of a and of b. (ii) Express the given equation in another form suitable for a straight-line graph to be drawn. State the variables whose values should be plotted.
. • Explain how a straight-line graph of against can be drawn to represent the given equation and draw it for the given data. Use this graph to estimate the value of a and of b. (i) (1) In order to plot 1/y against 1/x, we need to arrange the equation into (1). b/a represents the gradient and 1/a represents the y-intercept.
1.0 0.8 0.6 0.4 0.2 1.0 0.2 0.4 0.6 0.8 Choose appropriate scales
1.0 0.8 0.6 0.4 0.2 1.0 0.2 0.4 0.6 0.8 (0.6, 0.7) (0,0.2)
(ii) Express the given equation in another form suitable for a straight-line graph to be drawn. State the variables whose values should be plotted.
Q1 The data for x and y given in the table below are related by a law of the form , where p and q are constants. By drawing a suitable straight line, find estimates for p and q. Plot (y ─ x) against x2, p represents the gradient and q represents the y-intercept.
45 40 35 30 25 20 15 10 5 25 5 10 15 20
Q2 The table below shows experimental values of two variables, x and y. One value of y has been recorded incorrectly. It is believed that x and y are related in the form y = x 2– ax + b, where a and b are constants. Draw a suitable straight-line graph to represent the given data. Use your graph to estimate (i) the value of a and of b, (ii) a value of y to replace the incorrect value. Plot (y ─ x2) against x, ─ a represents the gradient and b represents the y-intercept.
5 4 3 2 1 5 1 2 3 4 -1 -2 -3 -4 -5
Q3 The table shows the experimental values of two variables x and y which are known to be related by an equation of the form p(x + y – q) = qx3, where p and q are constants. • Draw a suitable straight-line graph to represent the above data. • Use your graph to estimate • the value of p and of q, • the value of y when x = 2.2. Plot (x + y) against x3, (q/p) represents the gradient and q represents the y-intercept.
10 8 6 4 2 5 10 15 20
? 16 14 12 10 8 6 4 2 5 1 2 3 4 6 7 One of the values of y is subject to an abnormally large error Identify the abnormal reading and estimate its correct value. abnormal reading: y = 3.71 Correct value should be
16 14 12 10 8 6 4 2 5 1 2 3 4 6 7 Estimate the value of x when y = 2
The table below shows the experimental values of two variables x and y. It is known that one value of y has been recorded incorrectly Q4 It is known that x and y are related by an equation of the form , where a and b are constants. By plotting • against x, obtain a straight-line graph to represent the above data. • Use your graph to estimate the value of a and of b, giving your • answer to the nearest integers. • Use your graph to estimate a value of y to replace the • incorrect value. • (ii) Find the value of x when y = . (iii) By inserting another straight line to your graph, find the value of x and of y which satisfy the simultaneous equations and
1.6 1.4 1.2 1.0 0.8 0.6 0.4 0.2 2.5 0.5 1.0 1.5 2.0
1.6 1.4 1.2 1.0 0.8 0.6 0.4 0.2 2.5 0.5 1.0 1.5 2.0 abnormal reading: y = 0.70 Correct value should be
1.6 1.4 1.2 1.0 0.8 0.6 0.4 0.2 2.5 0.5 1.0 1.5 2.0 Estimate the value of x when y =
Need to draw this and find the point of intersection of the 2 lines and Bear in mind: need to use the same axes as first line! Vertical intercept (0, -1.2) Horizontal intercept (0.8, 0)
Vertical intercept (0, -1.2) Horizontal intercept (0.8, 0) 1.6 1.4 1.2 1.0 0.8 0.6 0.4 0.2 2.5 0.5 1.0 1.5 2.0 -0.2 -0.4 -0.6 -0.8 -1.0 -1.2
The variables x and y are known to be connected by the equation Q5 An experiment gave pairs of values of x and y as shown in the table. One of the values of y is subject to an abnormally large error. Plot lg y against x and use the graph to (i) identify the abnormal reading and estimate its correct value. (ii) estimate the value of C and of a. (iii) estimate the value of x when y = 1.
2.0 1.8 1.6 1.4 1.2 1.0 0.8 0.6 0.4 0.2 5 1 2 3 4 6 7 (i) abnormal reading: y = 25.10 Correct value should be
estimate the value of x when y = 1. 2.0 1.8 1.6 1.4 1.2 1.0 0.8 0.6 0.4 0.2 5 1 2 3 4 6 7 8 9