Download
1 / 68
680 likes | 712 Vues
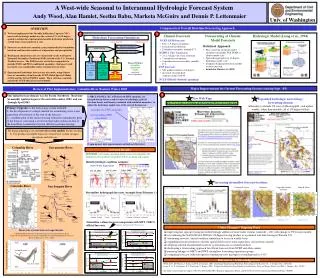
Effects of Climate Change and Climate Variability on the Water Cycle in the Western U.S. Alan F. Hamlet, Philip W. Mote, Dennis P. Lettenmaier JISAO/CSES Climate Impacts Group Dept. of Civil and Environmental Engineering University of Washington. Example of a flawed water planning study:

E N D
Effects of Climate Change and Climate Variability on the Water Cycle in the Western U.S. • Alan F. Hamlet, • Philip W. Mote, • Dennis P. Lettenmaier • JISAO/CSES Climate Impacts Group • Dept. of Civil and Environmental Engineering • University of Washington
Example of a flawed water planning study: The Colorado River Compact of 1922 The Colorado River Compact of 1922 divided the use of waters of the Colorado River System between the Upper and Lower Colorado River Basin. It apportioned **in perpetuity** to the Upper and Lower Basin, respectively, the beneficial consumptive use of 7.5 million acre feet (maf) of water per annum. It also provided that the Upper Basin will not cause the flow of the river at Lee Ferry to be depleted below an aggregate of 7.5 maf for any period of ten consecutive years. The Mexican Treaty of 1944 allotted to Mexico a guaranteed annual quantity of 1.5 maf. **These amounts, when combined, exceed the river's long-term average annual flow**.
What’s the Problem? Despite a general awareness of these issues in the water planning community, there is growing evidence that future climate variability will not look like the past and that current planning activities, which frequently use a limited observed streamflow record to represent climate variability, are in danger of repeating the same kind of mistakes made more than 80 years ago in forging the Colorado River Compact. Long-term water supply planning and specific agreements influenced by this planning (e.g. long-term water allocation agreements) should be informed by the best and most complete climate information available, but frequently they are not.
Hydrologic Model Domain and Cool Season Climate of the Western U.S. PNW GB CA CRB DJF Temp (°C) NDJFM Precip (mm)
Natural AND human influences explain the observations of global warming best. Natural Climate Influence Human Climate Influence All Climate Influences
+3.2°C °C +1.7°C +0.7°C 1.2-5.5°C 0.9-2.4°C Observed 20th century variability 0.4-1.0°C Pacific Northwest
Precipitation Uncertainties
Differences in cool and warm season precipitation trends suggest different mechanisms (large-scale advective storms vs. smaller scale convective storms) and differing sensitivity to regional warming. Trends in warm season precipitation in the CRB are very different than the other regions and may function more like cool season precipitation (e.g. related to circulation rather than locally generated storms)
% -1 to +3% +6% +2% +1% Observed 20th century variability -2 to +21% -1 to +9% Pacific Northwest
Change in Pacific Northwest winter precipitation for HadCM3 between 1970-2000 and 2030-2060 Change = - 2% *Signal to noise ratio is low* 628 614
Change in Pacific Northwest winter precipitation for ECHAM5 between 1970-2000 and 2030-2060 Change = + 5.4% *Signal to noise ratio is low* 571 602
Super ensemble CDFs of PNW cool season precipitation for four 30 year time slices from nine GCM simulations Sample Size = 270 years
Regionally Averaged Cool Season Precipitation Anomalies PRECIP
Sacramento and Upper Colorado Annual Flow Reconstructions Concurrent periods of low flow are indicated by pink bands Meko, D.M. and C.A. Woodhouse, 2005: Tree-ring footprint of joint hydrologic drought in Sacramento and Upper Colorado river basins, western USA. Journal of Hydrology, 308 (1-4): 196-213
Trends in Annual Streamflow at The Dalles from 1858-1998 are strongly downward.
Will Global Warming be “Warm and Wet” or “Warm and Dry”? Answer: Probably BOTH!
Remarks Regarding Precipitation Trends in cool season precipitation and the summer monsoon in the southwest U.S. are ambiguous and do not seem to be related to regional expressions of global warming. Warm season precipitation in the PNW, CA, and GB, however, seems to be steadily increasing with warming. Unambiguous changes in cool season precipitation variability have occurred starting in about 1975 in the West, coincident with (but not necessarily related to) rapid greenhouse-forced warming. Are trends in warm season precipitation and changes in cool season precipitation variability linked to warming?
Hydrologic Changes Associated with Warming And Altered Precipitation Variability
PNW GB CA CRB Schematic of VIC Hydrologic Model and Energy Balance Snow Model Snow Model
Changes in Mean Temperature and Precipitation or Bias Corrected Output from GCMs ColSim Reservoir Model VIC Hydrology Model
Sensitivity of Snowmelt and Transient Rivers to Changes in Temperature and Precipitation • Temperature warms, • precipitation unaltered: • Streamflow timing is altered • Annual volume stays about the same • Precipitation increases, • temperature unaltered: • Streamflow timing stays about the same • Annual volume is altered
Seasonal Water Balance Naches River Current Climate More runoff in winter and early spring, less in summer 2040s Scenario (+ 2.5 C)
For areas that accumulate snowpack in winter, the warmest locations are most sensitive to warming +2.3C, +4.5% winter precip
Changes in Simulated April 1 Snowpack for the Canadian and U.S. portions of the Columbia River basin (% change relative to current climate) 20th Century Climate “2020s” (+1.7 C) “2040s” (+ 2.25 C) -3.6% -11.5% -21.4% -34.8% April 1 SWE (mm)
Simulated Changes in Natural Runoff in the Snowmelt-Dominant Naches River Basin Associated with 2 C Warming • Impacts: • Increased winter flow • Earlier and reduced peak flows • Reduced summer flow volume • Reduced late summer low flow
Simulated Changes in Natural Runoff in the Rain Dominant Chehalis River Basin Associated with 2 C Warming
Although GCM scenarios and hydrologic models continue to improve, the implications of warming for snowmelt hydrology has been well understood for several decades. Sensitivity of Pacific Northwest water resources to global warming. Lettenmaier,-D.-P.; Brettmann,-K.-L.; Vail,-L.-W.; Yabusaki,-S.-B.-; Scott,-M.-J. Northwest-Environmental-Journal. 1992. 8(2), pp 265-283.
Observed Changes in the 20th Century
A Time Series of Temporally Smoothed, Regionally Averaged Met Data for the West
Linear Trends in Cool and Warm Season Climate for 1916-2003 and 1947-2003 (% per century for precip, degrees C per century for temperature)
Global T as a Predictive Variable for TMAX Trends Over the West TMAX R2 = 0.62
Global T as a Predictive Variable for TMIN Trends Over the West TMIN R2 = 0.81
Global Climate Models Reproduce These Patterns of Variability at the Global Scale
Trends in April 1 SWE 1950-1997 Mote P.W.,Hamlet A.F., Clark M.P., Lettenmaier D.P., 2005, Declining mountain snowpack in western North America, BAMS, 86 (1): 39-49
Overall Trends in April 1 SWE from 1947-2003 DJF avg T (C) Trend %/yr Trend %/yr
Temperature Related Trends in April 1 SWE from 1947-2003 DJF avg T (C) Trend %/yr Trend %/yr
Precipitation Related Trends in April 1 SWE from 1947-2003 DJF avg T (C) Trend %/yr Trend %/yr
1916-2003 DJF avg T (C) Decadal Variability Doesn’t Explain the Temperature Related Effects on Snowpack Trend %/yr 1947-2003 DJF avg T (C) 1925-1946 with 1977-2003 DJF avg T (C) Trend %/yr
Wide-Spread Glacial Retreat has Accompanied 20th Century Warming. Loss of glacial mass may increase summer flow in the short term and decrease summer flow in the long term. 1902 2002 The recession of the Illecillewaet Glacier at Rogers Pass between 1902 and 2002. Photographs courtesy of the Whyte Museum of the Canadian Rockies & Dr. Henry Vaux.
Snowpack is melting earlier Hamlet A.F.,Mote P.W, Clark M.P., Lettenmaier D.P., 2005: Effects of temperature and precipitation variability on snowpack trends in the western U.S., J. of Climate, 18 (21): 4545-4561 Simulated Change in Date of 90% Melt 1916-2003
As the West warms, spring flows rise and summer flows drop Stewart IT, Cayan DR, Dettinger MD, 2005: Changes toward earlier streamflow timing across western North America, J. Climate, 18 (8): 1136-1155
Trends in April 1 SWE for the WA and OR Cascades -19% Effects of Temperature And Precipitation -2.15% per decade -25% Effects of Temperature Alone -2.84% per decade
Trends in April 1 SWE for the WA and OR Cascades -35% Effects of Temperature And Precipitation -6.48% per decade -23% Effects of Temperature Alone -4.25% per decade
Flood risks have increased in many coastal areas with warm winter temperatures, whereas colder inland areas show decreases in flood risk. Simulated Changes in the 20-year Flood Associated with 20th Century Warming DJF Avg Temp (C) X20 2003 / X20 1915 X20 2003 / X20 1915
Regionally Averaged Cool Season Precipitation Anomalies PRECIP
20-year Flood for “1973-2003” Compared to “1916-2003” for a Constant Late 20th Century Temperature Regime DJF Avg Temp (C) X20 ’73-’03 / X20 ’16-’03 X20 ’73-’03 / X20 ’16-’03