Download
1 / 6
60 likes | 74 Vues
This study examines the distributions of loneliness scales among all populations and specifically among European Americans. It also explores the classification of ethnicity based on race and self-reported data.

E N D
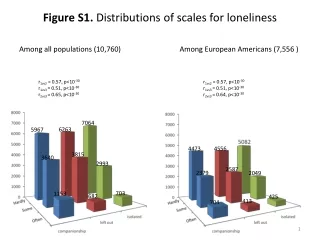
Figure S1. Distributions of scales for loneliness Among all populations (10,760) Among European Americans (7,556 ) r1vs2 = 0.57, p<10-30 r1vs3 = 0.51, p<10-30 r2vs3 = 0.65, p<10-30 r1vs2 = 0.57, p<10-30 r1vs3 = 0.51, p<10-30 r2vs3 = 0.64, p<10-30 7064 6263 5967 4556 4473 3815 3640 2993 2587 2379 2049 703 1153 682 425 413 704
Figure S2. Distributions of summed loneliness scales (3-9) For the Case: Control definition, those scored 4 and 5 were set as missing values
Figure S3. Race classified by PC1/PC2 and Self-reported Ethnicity x self-reported EA ● self-reported AA o self-reported Hispanic ◊ self-reported other PC1 PC2
Figure S4. GWAS for Linear Mixed Models in imputed data using all 10,760 subjects Linear trait (N= 10,760) λ=1.02 λ1000 =1.00
Figure S5. GWAS for Multivariate Linear Mixed Models in imputed data using all 10,760 subjects Multivariate (N= 10,760) λ=1.00 λ1000 =1.00
Figure S6. GWAS for Case: Control analysis in imputed data using all 7,436 Case:Control subjects L Case:Control (N= 7,436) λ=1.02 λ1000 =1.00


