Download
1 / 3
30 likes | 122 Vues
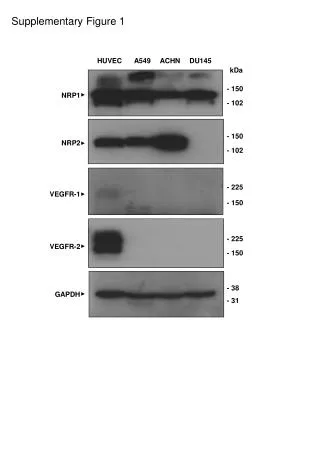
This supplementary figure shows the molecular weight (kDa) ranges of key proteins NRP1, NRP2, VEGFR-1, VEGFR-2, and GAPDH in various cell lines. The data provides insights into the protein expression profiles in different cell types.

E N D
Supplementary Figure 1 HUVEC A549 ACHN DU145 kDa - 150 NRP1 - 102 - 150 NRP2 - 102 - 225 VEGFR-1 - 150 - 225 VEGFR-2 - 150 - 38 GAPDH - 31
NRP1 GAPDH Supplementary Figure 2 C siRNA C #4914 #4820 kDa - 150 - 102 - 38 - 31


