Download
1 / 8
80 likes | 343 Vues
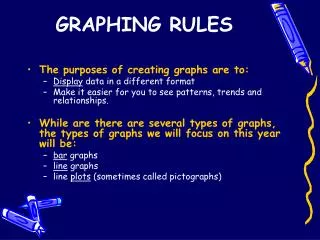
Types of Graphs and Graphing Rules. Unit 1. Types of Graphs. There are three types of graphs that we will use in this class: Line Graphs Bar Graphs Pie Graphs. Line Graphs. These graphs are used to show continuous change, usually over time

E N D
Types of Graphs • There are three types of graphs that we will use in this class: • Line Graphs • Bar Graphs • Pie Graphs
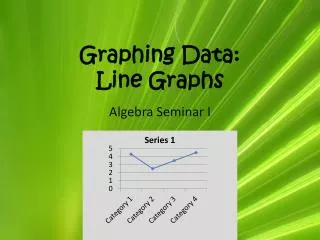
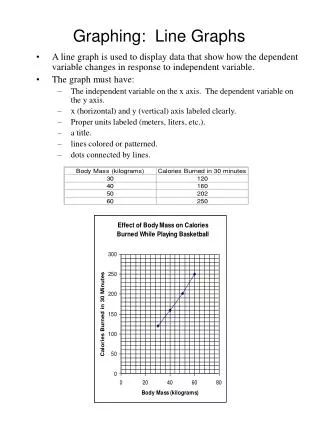
Line Graphs • These graphs are used to show continuous change, usually over time • For example, you might want to show the progress of something over a period of time
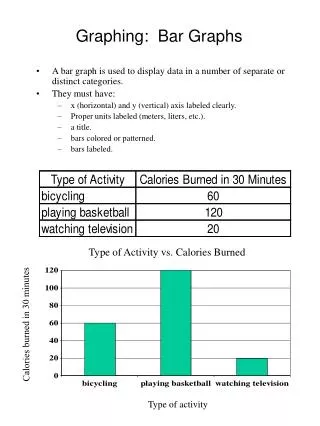
Bar Graphs • These graphs are used to show a comparison between data or between different IVs • For example, when comparing the number of students who like various types of fruit
Pie Graphs • These are used to show the different parts or percentages of a whole • For example, the percentages of students at Wagner who are involved in the various clubs and those who are not
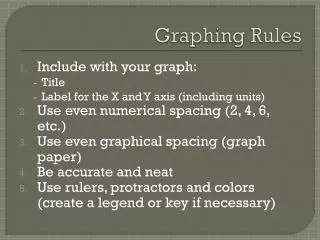
Graphing Rules • All graphs must have a Title • Usually in the form of “The Effect of the IV on the DV” • All axes should be labeled with titles and the units of measurement • All integers along each axis should be spaced equally and full use made of the entire graphing space
Graphing Rules • The independent variable is graphed along the horizontal X-axis • The dependent variable is graphed along the vertical Y-axis • Always provide a keyor legend when graphing more than one set of data
Draw a set of axes… • Label them with these words in the correct location • Title “The Effect of IV on DV” • Horizontal X-Axis • Vertical Y-Axis • Legend or Key • IV Independent Variable • DV Dependent Variable • Units of measurement