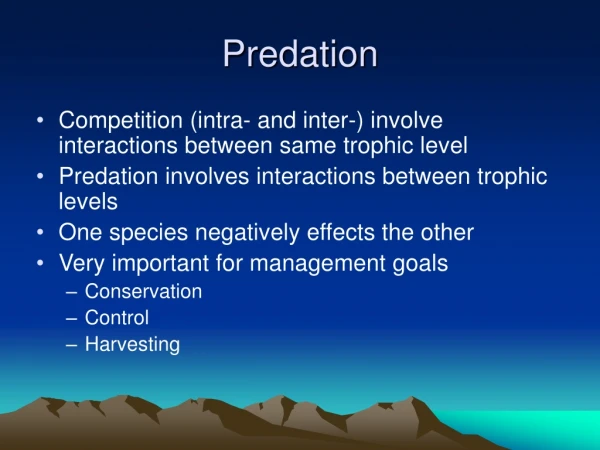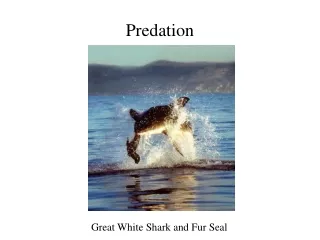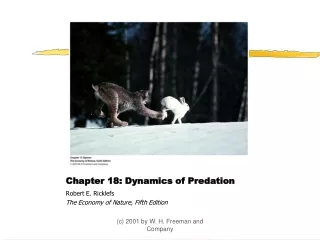
Chapter 10 Predation
Chapter 10 Predation. © 2002 by Prentice Hall, Inc. Upper Saddle River, NJ 07458. Outline. There are a variety of antipredator adaptations, which suggests that predation is important in nature Predator-prey models can explain many outcomes

Chapter 10 Predation
E N D
Presentation Transcript
Chapter 10Predation © 2002 by Prentice Hall, Inc. Upper Saddle River, NJ 07458
Outline • There are a variety of antipredator adaptations, which suggests that predation is important in nature • Predator-prey models can explain many outcomes • Field data suggests that predators have a large impact on prey populations
Outline • Experiments involving the removal or introduction of exotic predators provide good data on the effects of predators on their prey • Field experiments involving the manipulations of native populations show predation to be a strong force
Equilibrium theories of population regulation • A. Extrinsic biotic school • 1. Food supply and population regulation • 2. Predation and population regulation • 3. Disease and population • B. Intrinsic school • 1. Stress and territoriality • 2. Genetic polymorphism hypothesis • 3. Dispersal
The causes of population change key factor analysis 主導因子分析 (一) Density-dependent factor 密度制約因子: (種內、種間因素)作用強度隨種群密度而變。A factor affecting population size whose intensity of action varies with density. (二) )Density independent factor非密度制約因素 (外界環境因素): having an influence on individuals that does not vary with the number of individuals per unit area in the population.
Density-dependent factor 密度制約因子:1. 種間因素 .食物、空間資源 種內、種間競爭 .病蟲害傳播速度 .個體成熟速度 .體質和繁殖力、生長發育、自相殘殺、外遷 .植物結實數量 .抗逆性 在橡樹蛾的生活史裡,有不同的生活環境,不同的掠食者,寄生、競爭、環境壓力,在不同時期裡會有不同的死亡率。
2.種間因素 .競爭 .掠食、寄生 .遺傳反饋機制(抗病種的培育) 澳洲野兔 粘液病毒 抗病種
Density independent factor .氣候因素 .土壤因素 .營養 .理化 .空間 .汙染
Extrinsic factors: External factors acting on populations . Predation, parasitism . Competition for food density depended . Competition for space density depended . Random stochastic change density independent . Weather
1.種內因素 種群是一個具有自我調節 (self regulation)機制的生活系統,可以按照自身的性質及環境狀況調節它們的數量。 *植物的自疏現象 *禾本科植物的分的產生和生長 *遺傳特性(抗逆性) *內分泌調節(旅鼠) Crowding stress 腎上腺髓質(adrenocorticotropin) 腦下腺 (Epinephrine) 腎上腺皮質(Corticoids) 危急反應 Alarm response
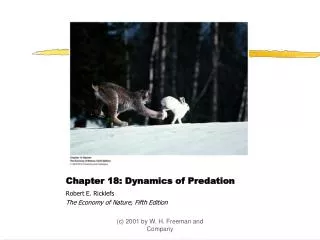
Introduction • Wolves in Yellowstone Park (Figure 10.1) • U.S. Fish and Wildlife Service, 1980’s • Reintroduce in Yellowstone Park and stabilize wolf populations in Minnesota and Montana • Concerns • Cattle ranchers concerned: Decimate herd? • Are predators tied to the health of the main prey? • Can predators switch prey? • Ramifications to reestablishment • Results: No major effects
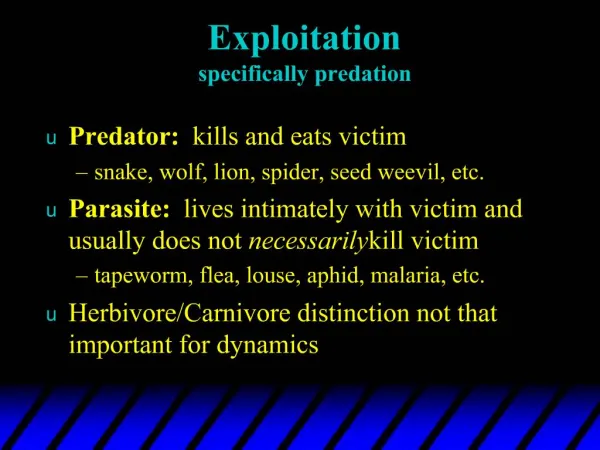
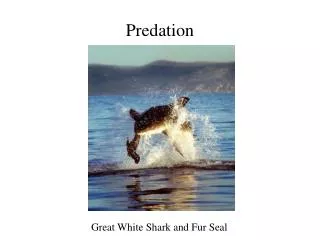
Introduction • Predation • Traditional view: carnivory • Differences from herbivory • Herbivory is non-lethal • Differences from parasitism • In parasitism, one individual is utilized for the development of more than one parasite
High Intimacy Parasitoids Parasite Low Predator Grazer High Lethality Low Introduction • Predation (cont.) • Predator-prey associations • Figure 10.2
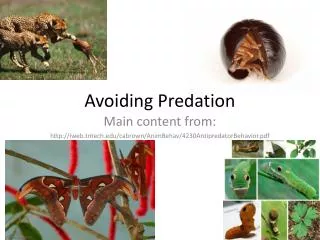
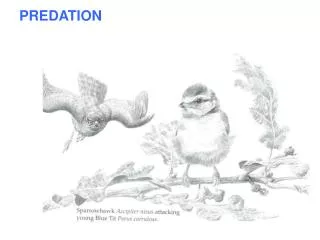
Antipredator Adaptations • Aposematic or warning coloration • Advertises an unpalatable taste • Ex. Blue jays and monarch butterflies • Caterpillar obtains poison from milkweed
Antipredator Adaptations • Ex. Blue jays and monarch butterflies (cont.) • Blue jays suffer violent vomiting from ingesting caterpillar • Ex. Tropical frogs • Toxic skin poisons • Figure 10.3a
Antipredator Adaptations • Camouflage • Blending of organism into background color • Grasshoppers (Figure 10.3b)
Antipredator Adaptations • Camouflage (cont.) • Stick insects mimic twigs and branches • Zebra stripes: blend into grassy background • Mimicry
Antipredator Adaptations • Mimicry (cont.) • Animals that mimic other animals • Ex. Some hoverflies mimic wasps Mimicry • Types of mimicry • Müllerian mimicry • Fritz Müller, 1879 • Unpalatable species converge to look the same
Antipredator Adaptations • Unpalatable species converge to look the same (cont.) • Reinforce basic distasteful design • Ex. Wasps and some butterflies • Mimicry ring: a group of sympatric species, often different taxa, share a common warning pattern • Batesian mimicry • Henry Bates, 1862 • Mimicry of unpalatable species by palatable species
Antipredator Adaptations • Batesian mimicry (cont.) • Ex. hoverflies resemble stinging bees and wasps (Figure 10.3d)
Antipredator Adaptations • Difficulty distinguishing type of mimicry • Monarch butterflies and viceroy butterflies (Figures 10.3d,e)
Antipredator Adaptations • Displays of intimidation • Ex. Toads swallow air to make themselves appear larger • Ex. Frilled lizards extend their collars to produce the same effect (Figure 10.3f)
Antipredator Adaptations • Polymorphism • Two or more discrete forms in the same population • Color polymorphism • Predator has a preference (usually the more abundant form) • Prey can proliferate in the rarer form
Antipredator Adaptations • Color polymorphism (cont.) • Ex. leafhopper nymphs (orange and black) • Ex. Pea aphids (red and green) • Reflexive selection • Every individual is slightly different • Examples: brittle stars, butterflies, moths, echinoderms, and gastropods
Antipredator Adaptations • Reflexive selection (cont.) • Thwart predators’ learning processes • Prey phenologically separated from predator • Ex. Fruit bats • Either diurnal or nocturnal • Only nocturnal in the presence of predatory diurnal eagles
Antipredator Adaptations • Chemical defense • Used to ward off predators • Ex. bombardier beetles • Possess a reservoir of hydroquinone and hydrogen perioxide • When threatened, eject chemicals into “explosion chamber”
Antipredator Adaptations • Ex. bombardier beetles (cont.) • Mix with peroxidase enzyme • Mixture is violently sprayed at attacker • Masting • Synchronous production of many progeny by all individuals in population
Antipredator Adaptations • Masting (cont.) • Satiate predators • Allows for some progeny to survive • Common to seed herbivory • Ex. 17-year and 13-year periodical cicadas
Antipredator Adaptations • Comparison of defense mechanisms • Table 10.1, chemical defense is most common
Predator-Prey Models • Effects of predators on prey • Depend on such things as prey and predator densities, and predator efficiency • Graphical method to monitor relationship
Predator-Prey Models • Graphical method to monitor relationship (cont.) • Prey isoclines have characteristic hump shape • Figure 10.4
i) Prey iscoline N 2 Predator density Prey increase N K ii) Predator iscoline 1 1 N 2 K 2 Predator increases Predator decreases Predator density N Prey density 1
Predator-Prey Models • Prey isoclines have characteristic hump shape (cont.) • In the absence of predators, prey density would be equal to the carrying capacity, K1 • Lower limit, individuals become too rare to meet for reproduction
Predator-Prey Models • Prey isoclines have characteristic hump shape (cont.) • Between these two values, prey population can either increase or decrease depending on predator density • Above the isocline, prey populations decline
Predator-Prey Models • Prey isoclines have characteristic hump shape (cont.) • Below the isocline, prey populations increase • Predator isoclines • Threshold density, where predator population will increase • Predator population can increase to carrying capacity
Predator-Prey Models • Predator isoclines (cont.) • Mutual interference or competition between predators • More prey required for a given density predator • Predator isoclines slopes toward the right • Superimpose prey and predator isoclines • Figure 10.5
Predator-Prey Models • Superimpose prey and predator isoclines (cont.) • One stable point emerges: the intersection of the lines • Three general cases • Inefficient predators require high densities of prey (Figure 10.5a)
a) Damped oscillations Predator isocline Prey isocline
Predator-Prey Models • Three general cases (cont.) • A moderately efficient predator leads to stable oscillations of predator and prey populations (Figure 10.5b)
Stable oscillations b) Predator equilibrium density Population density
Predator-Prey Models • Three general cases (cont.) • A highly efficient predator can exploit a prey nearly down to its limiting rareness (Figure 10.5c)
c) Increasing oscillations Predator density
Predator-Prey Models • All based on how efficient predator is • Shift in isoclines • Prey starvation (shift to left) • Food enrichment (shift to right) (Figure 10.5d)
“The paradox of enrichment” d) K1 increases to K1* with enrichment Prey Prey isocline changes Predator isocline remains unchanged Predator K1 K1*
Predator-Prey Models • Food enrichment (shift to right) (cont.) • Carrying capacity changes • Predator isocline changes – “paradox enrichment” : Increases in nutrients or food destabilizes the system
Predator-Prey Models • Functional response • How an individual predator responds to prey density can affect how predators interact with prey (Figure 10.6)
I Number of prey eaten per predator II III Prey density
Predator-Prey Models • Functional response (cont.) • Three types • Type I: Individuals consume more prey as prey density increases • Type II: Predators can become satiated and stop feeding, or limited by handling time.
Predator-Prey Models • Three types (cont.) • Type III: Feeding rate is similar to logistic curve; low at low prey densities, but increases quickly at high densities • Changes in prey consumption • Functional response changes (Figure 10.7)