
SlideServe
Menu
Préférences
© SlideServe · v2026

Subtropical Cyclones

tracey avatar
25 diapositives · 473 Views · Jul 29, 2014

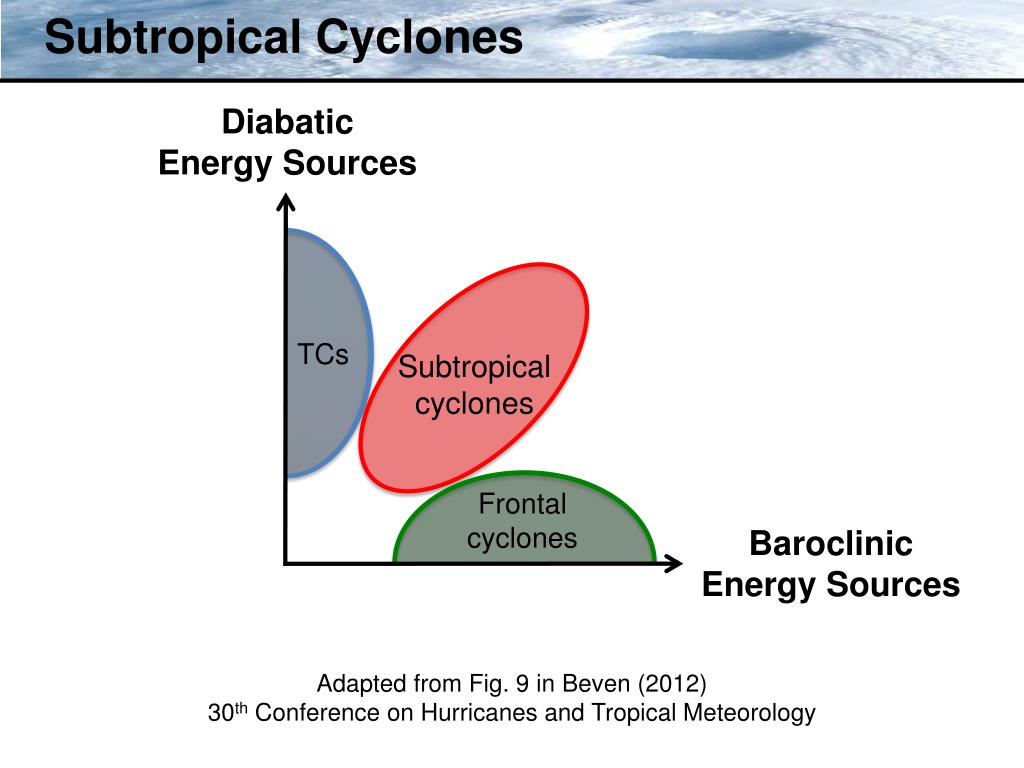
Subtropical Cyclones. Diabatic Energy Sources. TCs. Subtropical cyclones. Frontal cyclones. Baroclinic Energy Sources. Adapted from Fig. 9 in Beven (2012) 30 th Conference on Hurricanes and Tropical Meteorology. Adapted Davis (2010) Methodology. Davis (2010) methodology:
Subtropical Cyclones - slide 1
01 / 25Subtropical Cyclones
1 / 17

Télécharger la présentation

Subtropical Cyclones
Une image / un lien ci-dessous est fourni (tel quel) pour télécharger la présentation

Politique de téléchargement : le contenu du site vous est fourni TEL QUEL pour votre information et votre usage personnel ; il ne peut être vendu, concédé sous licence ni partagé sur d’autres sites sans l’accord de son auteur.Le contenu vous est fourni TEL QUEL, pour votre information et votre usage personnel uniquement. Téléchargez la présentation en cliquant sur ce lien. Lors du téléchargement, si vous ne parvenez pas à télécharger une présentation, l’éditeur a peut-être supprimé le fichier de son serveur.Pendant le téléchargement, si vous ne parvenez pas à obtenir une présentation, le fichier a peut-être été supprimé par l’éditeur.

F I N

Plus de contenu associé

Transcription de la présentation
  1. Subtropical Cyclones DiabaticEnergySources TCs Subtropical cyclones Frontal cyclones BaroclinicEnergy Sources Adapted from Fig. 9 in Beven (2012)30th Conference on Hurricanes and Tropical Meteorology

  2. Adapted Davis (2010) Methodology • Davis (2010) methodology: • Based on Ertel potential vorticity (PV) • Formulated in terms of two PV metrics that quantify the relative contributions of baroclinicprocesses and condensation heating to the evolution of individual cyclones • Davis (2010) methodology is similar to Hart (2003) cyclone phase space diagrams

  3. Adapted Davis (2010) Methodology • Lower-troposphericbaroclinic processes:(near-surface potentialtemperature anomaly) 425 hPa Length of 6° box centered on cyclone Potential temperature anomaly absolute vorticity

  4. Adapted Davis (2010) Methodology absolute vorticity • Lower-troposphericbaroclinic processes:(near-surface potentialtemperature anomaly) • Midtroposphericlatent heat release:(interior PVanomaly) 425 hPa Length of 6° box centered on cyclone Potential temperature anomaly Ertel PV anomaly PV1/PV2 : measure of the contribution of lower-troposphericbaroclinic processes relative to the contribution of condensation heating

  5. Adapted Davis (2010) Methodology 200 hPa 925 hPa

  6. Adapted Davis (2010) Methodology • Lower-troposphericbaroclinic processes:(near-surface potentialtemperature anomaly) 200 hPa 925 hPa Lower-tropospheric baroclinic processes (PV1)

  7. Adapted Davis (2010) Methodology • Lower-troposphericbaroclinic processes:(near-surface potentialtemperature anomaly) • Midtroposphericlatent heat release:(interior PV anomaly) 200 hPa 925 hPa Lower-tropospheric baroclinic processes (PV1)

  8. Adapted Davis (2010) Methodology • Lower-troposphericbaroclinic processes:(near-surface potentialtemperature anomaly) • Midtroposphericlatent heat release:(interior PV anomaly) 200 hPa 500 hPa Midtroposphericlatent heat release (PV2) 925 hPa Lower-tropospheric baroclinic processes (PV1) PV1/PV2 : measure of the contribution of lower-tropospheric baroclinic processes relative to the contribution of condensation heating

  9. Adapted Davis (2010) Methodology • Additional metric introduced to diagnose upper-tropospheric dynamical processes • Upper-troposphericdynamical processes:(upper-tropospheric PV anomaly) Ertel PV anomaly 300 hPa Length of 6° box centered on cyclone

  10. Adapted Davis (2010) Methodology • Lower-troposphericbaroclinic processes:(near-surface potentialtemperature anomaly) • Midtroposphericlatent heat release:(interior PV anomaly) 200 hPa 500 hPa Midtroposphericlatent heat release (PV2) 925 hPa Lower-tropospheric baroclinic processes (PV1) PV1/PV2 : measure of the contribution of lower-troposphericbaroclinic processes relative to the contribution of condensation heating

  11. Adapted Davis (2010) Methodology • Lower-troposphericbaroclinic processes:(near-surface potentialtemperature anomaly) • Midtroposphericlatent heat release:(interior PV anomaly) • Upper-troposphericdynamical processes:(upper-tropospheric PV anomaly) Upper-troposphericdynamical processes(PV3) 200 hPa 500 hPa Midtroposphericlatent heat release (PV2) 925 hPa Lower-tropospheric baroclinic processes (PV1) PV1/PV2 : measure of the contribution of lower-troposphericbaroclinic processes relative to the contribution of condensation heating

  12. Adapted Davis (2010) Methodology Upper-troposphericdynamical processes(PV3) 200 hPa Calculated from the 0.5° Climate ForecastSystem Reanalysis V2 dataset 500 hPa Midtroposphericlatent heat release (PV2) 925 hPa Lower-tropospheric baroclinic processes (PV1) PV1/PV2 : measure of the contribution of lower-troposphericbaroclinic processes relative to the contribution of condensation heating

  13. Hurricane Sandy: 6° × 6° box, NHC Best Track Peaks in PV3 PVU PV1/PV2 22 October 23 October 24 October 25 October 26 October 27 October 28 October 29 October 30 October 31 October

  14. Hurricane Sandy: 10° × 10° box, NHC Best Track Peaks in PV3 PVU PV1/PV2 22 October 23 October 24 October 25 October 26 October 27 October 28 October 29 October 30 October 31 October

  15. Hurricane Sandy: 12° × 12° box, NHC Best Track Peaks in PV3 PVU PV1/PV2 22 October 23 October 24 October 25 October 26 October 27 October 28 October 29 October 30 October 31 October

  16. Hurricane Sandy: 14° × 14° box, NHC Best Track Peaks in PV3 PVU PV1/PV2 22 October 23 October 24 October 25 October 26 October 27 October 28 October 29 October 30 October 31 October

  17. Hurricane Sandy: 16° × 16° box, NHC Best Track Peaks in PV3 PVU PV1/PV2 22 October 23 October 24 October 25 October 26 October 27 October 28 October 29 October 30 October 31 October

  18. Hurricane Sandy: 18° × 18° box, NHC Best Track Peaks in PV3 PVU PV1/PV2 22 October 23 October 24 October 25 October 26 October 27 October 28 October 29 October 30 October 31 October

  19. Hurricane Sandy: 20° × 20° box, NHC Best Track Peaks in PV3 PVU PV1/PV2 22 October 23 October 24 October 25 October 26 October 27 October 28 October 29 October 30 October 31 October

  20. Adapted Davis (2010) Methodology • Lower-troposphericbaroclinic processes:(near-surface potentialtemperature anomaly) • Midtroposphericlatent heat release:(interior PV anomaly) • Upper-troposphericdynamical processes:(upper-tropospheric PV anomaly) Upper-troposphericdynamical processes(PV3) 200 hPa 500 hPa Midtroposphericlatent heat release (PV2) 925 hPa Lower-tropospheric baroclinic processes (PV1) PV1/PV2 : measure of the contribution of lower-troposphericbaroclinic processes relative to the contribution of condensation heating

  21. Adapted Davis (2010) Methodology • Lower-troposphericbaroclinic processes:(near-surface potentialtemperature anomaly) • Midtroposphericlatent heat release:(interior PV anomaly) • Upper-troposphericdynamical processes:(upper-tropospheric PV anomaly) Upper-troposphericdynamical processes(PV3) 200 hPa 300 hPa Midtroposphericlatent heat release (PV2) 925 hPa Lower-tropospheric baroclinic processes (PV1) PV1/PV2 : measure of the contribution of lower-troposphericbaroclinic processes relative to the contribution of condensation heating

  22. Hurricane Sandy: 6° × 6° box, 500 hPa, NHC Best Track Peaks in PV3 PVU PV1/PV2 22 October 23 October 24 October 25 October 26 October 27 October 28 October 29 October 30 October 31 October

  23. Hurricane Sandy: 6° × 6° box, 300 hPa, NHC Best Track Peaks in PV3 PVU PV1/PV2 22 October 23 October 24 October 25 October 26 October 27 October 28 October 29 October 30 October 31 October

  24. Adapted Davis (2010) Methodology • Lower-troposphericbaroclinic processes:(near-surface potentialtemperature anomaly) • Midtroposphericlatent heat release:(interior PV anomaly) • Upper-troposphericdynamical processes:(upper-tropospheric PV anomaly) Upper-troposphericdynamical processes(PV3) 200 hPa 300 hPa Midtroposphericlatent heat release (PV2) 925 hPa Lower-tropospheric baroclinic processes (PV1) PV1/PV2 : measure of the contribution of lower-troposphericbaroclinic processes relative to the contribution of condensation heating

  25. Adapted Davis (2010) Methodology Upper-troposphericdynamical processes(PV3) 200 hPa Calculated from the 0.5° Climate ForecastSystem Reanalysis V2 dataset 500 hPa Midtroposphericlatent heat release (PV2) 925 hPa Lower-tropospheric baroclinic processes (PV1) PV1/PV2 : measure of the contribution of lower-troposphericbaroclinic processes relative to the contribution of condensation heating