
Uploaded by
tymon
1 SLIDES
93 VUES
10LIKES
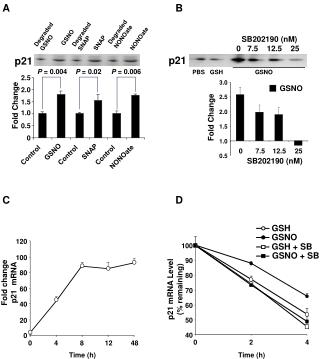
Evaluation of GSNO and p21 mRNA Level in Cell Treatment
DESCRIPTION
Comparative analysis of GSNO, SNAP, and SB effects on p21 mRNA levels in cellular models over time, revealing significant changes in gene expression.
Download
1 / 1
Télécharger la présentation 
Evaluation of GSNO and p21 mRNA Level in Cell Treatment
An Image/Link below is provided (as is) to download presentation
Download Policy: Content on the Website is provided to you AS IS for your information and personal use and may not be sold / licensed / shared on other websites without getting consent from its author.
Content is provided to you AS IS for your information and personal use only.
Download presentation by click this link.
While downloading, if for some reason you are not able to download a presentation, the publisher may have deleted the file from their server.
During download, if you can't get a presentation, the file might be deleted by the publisher.
E N D
Presentation Transcript
GSNO NONOate SNAP GSH GSNO p21 120 GSH + SB 100 P = 0.004 P = 0.02 P = 0.006 GSNO + SB 100 2.5 90 2.0 80 80 Fold change p21 mRNA 1.5 p21 mRNA Level (% remaining) Fold Change 60 70 1.0 40 60 0.5 0 50 20 GSNO SNAP 40 0 Control Control Control A B NONOate 0 2 4 0 4 8 12 48 Time (h) Time (h) Degraded NONOate Degraded SNAP Degraded GSNO SB202190 (nM) 0 7.5 12.5 25 p21 PBS GSH GSNO 3.0 GSNO 2.5 2.0 Fold Change 1.5 1.0 0 7.5 12.5 25 0.5 SB202190 (nM) C D


More Related