Mouse Islet miRNA Expression Changes in Obesity and Diabetes
190 likes | 225 Vues
This paper outlines the miRNA profiles of islet samples from B6 and BTBR mice, detailing the alterations in expression levels with obesity and strain differences. The study highlights specific miRNAs such as miR-211 and miR-375 and their abundance levels, along with significant changes observed in miR-132, miR-184, and miR-214. Experimental groups and confirmed miRNA expression patterns are discussed, indicating the differences in obesity and strain effects on miRNA expression. Additionally, proposed experiments exploring the physiological significance of strain differences and the role of miR-184 in regulating glucagon are outlined. Potential experiments related to GLP-1 responsiveness and miRNA induction are also suggested to further understand the impact of obesity and strain variation on miRNA expression in islets.

Mouse Islet miRNA Expression Changes in Obesity and Diabetes
E N D
Presentation Transcript
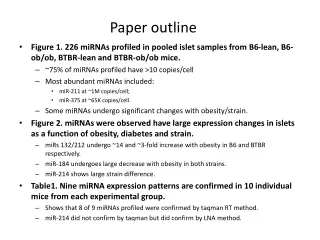
Paper outline • Figure 1. 226 miRNAs profiled in pooled islet samples from B6-lean, B6-ob/ob, BTBR-lean and BTBR-ob/ob mice. • ~75% of miRNAs profiled have >10 copies/cell • Most abundant miRNAs included: • miR-211 at ~1M copies/cell; • miR-375 at ~65K copies/cell. • Some miRNAs undergo significant changes with obesity/strain. • Figure 2. miRNAs were observed have large expression changes in islets as a function of obesity, diabetes and strain. • miRs 132/212 undergo ~14 and ~3-fold increase with obesity in B6 and BTBR respectively. • miR-184 undergoes large decrease with obesity in both strains. • miR-214 shows large strain difference. • Table1. Nine miRNA expression patterns are confirmed in 10 individual mice from each experimental group. • Shows that 8 of 9 miRNAs profiled were confirmed by taqman RT method. • miR-214 did not confirm by taqman but did confirm by LNA method.
211 375 132 214 212 184 Figure 1. average Copy number (copies per 10 pg total RNA) for 226 miRNAs profiled in pools of pancreatic islet. RNA is harvested from pancreatic islet derived from 10 wk old mice of B6-lean, B6-ob/ob, BTBR-lean or BTBR-ob/ob male mice. Then 226 miRNAs were profiled by LNA real time PCR. miRNA abundance are shown as copy number per 10 pg RNA. All 226 miRNA are ranked from most to least abundant, some miRNA such as miR-214 and 184 are highlighted. Horizontal dash line indicates a copy number of 10 which is arbitrary threshold below which we consider the miRNA does not expressed
Figure 2. obesity and strain alter miRNA expression in islet. The effect of obesity (A) and strain (B) on miRNA expression was determined in islet. In the A panel the ratio of miRNA copy number measured in obese vs. lean mice was determined for B6 and plotted against the same for BTBR. Values above or below 1.0 indicate an obesity-dependent change in miRNA copy number. In the B panel the ratio of miRNA copy number measured in B6 vs. BTBR lean mice was plotted against the same for obese mice. Value above or below 1.0 indicated a strain-dependent change in miRNA copy number. Any miRNA value that falls along the diagonal line indicate there is no difference. The mouse miRNA were analyzed using two different probes, a human probe(red), and mouse probe(black). miR-34a, 132, 212 and 184 show an obesity and/or strain- dependent change in abundance, respectively.
Table 1. Expression patterns of most miRNAs (8/9) determined by Taqman real time PCR are consistent with those did by LNA real time PCR result. miRNAs which showed significant change were profiled by Taqman real-time PCR in with10 individuals of male10-week-old of B6, B6 ob/ob, BTBR and BTBR ob/ob mice, per group, the miRNA expression are showed as delta CT value normalized to SnoRNA234 ±standard deviation, the last column showed the Pearson’s correlation between LNA measurement and Taqman measurement
Supplemental 2. Clinic phenotypes of animal cohort used in miRNA profiling.
Additional experiments for miRNA paper Microarray data and analysis Samples being profiled: 5 mice each for: miR-184, 212, 214 virus (can confirm over-expression). 10 mice for Ad-GFP for reference pool. GLP-1 induces miR-132/212 differently in B6 vs BTBR islets Proposed experiments to examine physiological significance of strain difference in GLP-1 responsiveness • GLP-1 induces expression of miR-132/212; • Obesity difference in regulation of miR-132/212 in B6 vs BTBR; • BTBR-ob/ob non-responsive animal model to GLP-1 elevation; • Coding SNP in GLP-1R miR-184 regulates glucagon Proposed experiments to examine relationship between: • Obesity regulation of miR-184 • miR-184’s regulation of glucagon • To what extent is miR-184 involved in obesity-regulation of glucagon?
magnitude difference in ob-induction of miR-132/212 in B6 vs BTBR islets 13.3 fold 9.5 fold 3.9 fold 2.9 fold
GLP-1 induce expression of miR-132/212 P=.0002 P=.001 P=.228 n=4 n=5 n=5 n=3 n=3 n=3 n=3
Sitagliptin improves HFD/STZ-treated B6 mice Diabetes 2006 vol55 p1695-1704
Sitagliptin decrease DPP4 activity and increase GLP-1 activity in BTBR-ob/ob
There is a coding SNP in GLP-1 receptor which located on the cell cycle hotspot in chromosome 17 BTBR: GLP1R R47H Macaca mulatta: rhesus monkeys Pan troglodytes: Common Chimpanzee mouse : B6 mouse strain
Yun-Ping and our lab observed the GLP-1 can induce miR-132 and 212 expression (above). • There is a coding SNP in conserve region of GLP-1 receptor. • We have shown that DPP4 inhibitor (sitagliptin) does not alter disease progression in BTBR-ob/ob mice. • Obesity induces miR-132/212 ~10-14-fold in B6 and only ~3-fold in BTBR mice. • Hypothesis: GLP-1 is less effective to induce miR-132/212 in BTBR vs B6 mice. • Experiment: Incubate B6 vs BTBR islets in GLP-1/Exendin-4 and measure miR-132 and 212 expression. • Do time course for GLP-1/Ex-4 for induction of miRs in B6 vs BTBR islets. • Repeat GSIS measure once we have optimal time point determined. • Exendin-4 useful to avoid degradation during in vitro incubation.
GLP-1 induce miR-132/212 in B6 mice • Follow up studies to address the “so what” challenge: • Is GLP-1 less effective in B6 vs BTBR mice to: • induce expression of miR-132/212 • enhance GSIS • elevate cAMP • promote proliferation/ prevent apoptosis • Is miR-132/212 induction by GLP-1 required for effect? • 2’-O-Me antagomirs to block endogenous miR activity • Cell line experiment • Profile islet in B6 vs BTBR mice following sitagliptin treatment • Identify GLP-1 responsive genes/miRNA s in B6 vs BTBR mice
miR-184 and glucagon • microarrays data in INS-1 cell showed that overexpression of miR-184 could knockdown 81% of glucagon mRNA in (24 hr) with P value of 0.005(confirmed in our hands 65% knockdown) • Glucagon is expressed and released from INS-1 cell • miR-184 knockdown 20% of glucagon mRNA in mouse islet BBRC Vol 330,(1), 29,2005, P 327-332 Cumulative release of glucagon Secretion in 1.4, 2.8, 5.6, 11.2 , 22.4 mM glucose Why is miR-184 less effective to knockdown glucagon in the islets compared to Ins-1 cells? Is this reflective of a-cells? The delivery efficiency: 100% oligo INS-1 vs ~50% virus islet The magnitude of over-expression : ~1000 fold olgio INS1 vs ~20 fold virus islet
Obesity decreases miR-184 expression and enhance both plasma and pancreatic glucagon Glucagon secretion Glucagon content Elevated levels of circulating glucagon in T2DM patients results in increased rates of hepatic glucose synthesis and glycogen metabolism, translating to excessive plasma glucose levels.
miR-184 and biosynthesis of glucagon Hypothesis: miR-184 decreases the expression of glucagon in a-cell Experiments to utilize islets and a-TC cells: • Over-express miR-184 • Ask if glucagon secretion is blunted in response to kainate or decreasing glucose. • Gcg mRNA and protein level changes? Glucagon secretion BBRC Vol 330,(1), 29,2005, P 327-332
Issues to address the “so what” challenge: • Is glucagon a direct or indirect target for miR-184? • Change in a-cell composition in ob vs lean islets • miR-184 DE gene and functional enrichment? • miR-184 on b-cell function? • Does anti-miR184 increase glucagon expression? • Cell types that express miR-184? • Correlation between miR-184 expression and obesity in human islets? • the expression of miR-184 in the obese mice from different age(young to 10 wk) • Mechanism of obesity-dependent decrease in miR-184 expression? • There is evidence showed that Mecp2-dependent repression of an imprinted miR-184 released by K+ depolarization in brain, does it also occur in pancreatic islet? • Retinoic acid induces miR-184 in a neuroblastoma cell line, does it also occur in pancreatic islet • Chromosome IP examine which region in the promoter of miR-184 responsible for the expression in lean but not in obesity • In vivo over-expression of miR-184 by AAV, lentivirus?