R-Graphics
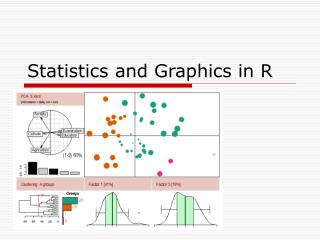
R-Graphics. Stephen Opiyo. Basic Graphs. One of the main reasons data analysts turn to R is for its strong graphic capabilities. R generates publication-ready figure s. "graphics" library loads by default when R is started. Ready to go as soon as R opens. Graphing basics.

R-Graphics
E N D
Presentation Transcript
R-Graphics Stephen Opiyo
Basic Graphs • One of the main reasons data analysts turn to R is for its strong graphic capabilities. • R generates publication-ready figures. • "graphics" library loads by default when R is started. • Ready to go as soon as R opens.
Graphing basics Plotting commands • High-level functions: Create a new plot on the graphics device • Low-level functions: Add more information to an already existing plot, such as extra points, lines, and labels
Common high-level functions • plot(): A generic function that produces a type of plot that is dependent on the type of the first argument. • hist(): Creates a histogram of frequencies • barplot(): Creates a histogram of values • boxplot(): Creates a boxplot
Example 1 • Download data D2_Data_1 • Open file D2_Example_1.R • R dataset mtcars
Lower level graphical functions pch (plotting characters)=“” : character or numbers col (color) = “” : character or numbers lty = numbers lwd = numbers axes = “L”: L= F, T xlab =“string”, ylab=“string” sub = “string”, main =“string” xlim = c(lo,hi), ylim= c(lo,hi) cex controls the symbol size in the plot, default is cex=1,
Lower level graphical functions plot typedescription: type= " " p= points l = lines o= over plotted points and lines b, c= points (empty if "c") joined by lines s= stair steps h= histogram-like vertical lines n = does not produce any points or lines
Lower-level graphing functions • pch=0,square • pch=1,circle • pch=2,triangle point up • pch=3,plus • pch=4,cross • pch=5,diamond • pch=6,triangle point down • pch=7,square cross • pch=8,star • pch=9,diamond plus • pch=10,circle plus • pch=11,triangles up and down • pch=12,square plus • pch=13,circle cross • pch=14,square and triangle down • pch=15, filled square blue • pch=16, filled circle blue • pch=17, filled triangle point up blue • pch=18, filled diamond blue • pch=19,solid circle blue • pch=20,bullet (smaller circle) • pch=21, filled circle red • pch=22, filled square red • pch=23, filled diamond red • pch=24, filled triangle point up red • pch=25, triangle point down red
Lower-level graphing functions Symbol shapes and colors
Lower-level graphing functions • Adding text text() text(x,y, “text”, options) points() add some more points to the graph points(x,y, options) Saving graphs in Rstudio
Example 2 • Download data D2_Data_2 • Open file D2_Example_2.R
Making a histogram • Make histograms with varying the number of bars (also called ‘bins’ or ‘cells’), e.g. simdata <-rchisq(100,8) hist(simdata) # default number of bins Setting your own breakpoints bps <- c(0,2,4,6,8,10,15,25) hist(simdata,breaks=bps)
3-dimensional Scatterplots • Need a package scatterplot3d • Install package scatterplot3d using install.packages("scatterplot3d") command • Alternatively install using Rstudio using Packages
Multiple graph on one page • Combining multiple plots using par () and mfrow = c(nrows, ncols) to create a matrix of nrows by ncols • ?par • par(mfrow=c(1,2))
Exercise par(mfrow=c(3,5)) plot(D2_Data_2[,2], D2_Data_2[,3], type="p", pch=1, col="1", xlab ="Peak1", ylab ="Peak2", main="Plot of Peak1 vs Peak2", font.main =1) Replace pch=1 and col =1 with 2 to 15: Export the graph and save it as Day_2_Graph.pdf