Enhancing Transportation Sustainability at UO: Insights from the 2013 Commuter Survey
190 likes | 306 Vues
The 2013 UO Commuter Survey aimed to update and inform the UO Climate Action Plan, examining commuting patterns of students and staff. Key findings revealed that 28% of respondents drive alone, while 26% bike, and 18% walk. The survey identified the need for improved bus services and alternative transit incentives such as guaranteed rides and carpool assistance. With vital data from over 1,200 respondents, the recommendations propose initiatives like peer-to-peer car-sharing, incentives for alternative transit use, and improved bike safety measures to enhance transportation sustainability on campus.

Enhancing Transportation Sustainability at UO: Insights from the 2013 Commuter Survey
E N D
Presentation Transcript
2013 UO Commuter Survey Kelly Groth, Hope Nealson, Qianyu Sui Mar 20, 2013
Table of Content I. Introduction II. Methodology III. Primary Findings IV. Recommendations
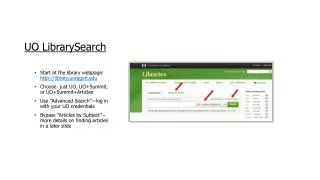
I. Introduction Goal • Update the UO Commuter Survey to inform the UO Climate Action Plan Baseline • 2009 Commuter Survey • 2010 Housing Survey • 2009 Transportation Survey Steps
Stakeholders • St Emily Eng – Planning Associate, Campus Planning and Real Estate Steve Mital – Director, UO Office of Sustainability
II. Methodology Expectations Timeline Exemption from IRB Request Donations Determine Sample Size Draft Survey on Qualtrics Acquire Email Addresses Pilot Survey/Revision Distribution of Survey Close Survey Survey Analysis
Facts of Commuter Survey • Sample Size • 5,700 surveyed • 4,800 students • 900 faculty/staff • 1,243 responded
III. Primary Findings Overall Modes Split 28% drive alone 26% bike 18% walk 13% bus 4% drop off 4% carpool 2% EmXonly 2% park & ride 2% other means
Single Occupancy Vehicle Riders Top three reasons
Top 3 Alternative Transit Incentives • More frequent bus service • Guaranteed free ride home/school • Help finding carpool
Student Commute Distribution • 828 students respondents • Bike 29% • Walk 25% • Bus 19% • Drive alone 16% • Carpool 3% • Students live closer to the UO than faculty • 90% SOV riders do not have a UO parking permit
Employee Commute Distribution 415 fac/staff respondents • Drive alone 47% • Bike 21% • Bus 8% • Carpool 7% • Walk 7% 39% SOV riders live just 3-5.9 miles away from campus 64% of SOV riders have parking permits
Additional Findings Of the 1,243 surveyed respondents, 77% of students and 65% of faculty/staff own a smartphone 10-14 minutesis a preferred transit time, 34% for students and 32% for faculty/staff
Recommendations Implementing peer-to-peer car-sharing program
Incentives for faculty and staff • Help arrange carpools or peer-to-peer carsharing • Discounts to take alternative transit • Free day parking passes • Pay-As-You-Drive (PAYD) auto insurance • Improve bike safety/showers for bicyclists
V. Conclusion • Advertisement of available transportation options • Web-portal • Mobile app • Improved bus service (LTD)
Thank you Q & A