Download
1 / 22
230 likes | 399 Vues
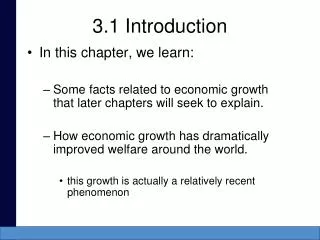
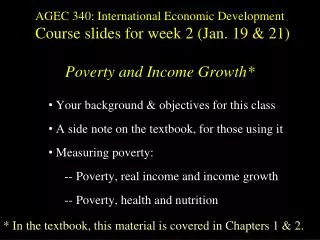
AGEC 340: International Economic Development Course slides for week 2 (Jan. 19 & 21) Poverty and Income Growth*. Your background & objectives for this class A side note on the textbook, for those using it Measuring poverty: -- Poverty, real income and income growth

E N D
AGEC 340: International Economic DevelopmentCourse slides for week 2 (Jan. 19 & 21)Poverty and Income Growth* Your background & objectives for this class A side note on the textbook, for those using it Measuring poverty: -- Poverty, real income and income growth -- Poverty, health and nutrition * In the textbook, this material is covered in Chapters 1 & 2.
A side note on the textbook… what fact discussed in Chapter 1 is already outdated? ? Click image to read the article…or click here for the latest data: www.fao.org/worldfoodsituation/FoodPricesIndex
What does “poverty” (or wealth) really mean? To measure and compare over all people, we add up all goods and services per person: Total production: Gross Domestic Product (GDP) = total value of activity done in a country Gross National Product (GNP) = total value of activity by a country’s people Production ≈ income, so: = Gross National Income (GNI)
Measuring Poverty:The Textbook Picture (Table 1-1, p. 19) Gross National Income per Capitain Selected Countries, 2002 Source: World Bank, World Development Indicators 2002.
How best to compare income levels across countries? We must convert values from local currency into a common measurement unit (US dollars), but how? if we use market exchange rates (like Table 1-1) we measure income in terms of the goods they can buy in other countries but local services prices differ across countries, and currency exchange rates fluctuate over time, so… we prefer to use purchasing power parity (PPP) prices measures income in terms of the goods they can buy in their own country for example, $1 at PPP prices ≈ about one day’s food
Poor places have lower incomes at market exchange rates than in PPP terms The D.R. Congo has a particularly low market exchange rate, so is less poor when measured in PPP terms Source: Calculated from IMF, International Financial Statistics.
Rich places have higher incomes at market exchange rates than in PPP terms The U.S. is 10th at market exchange rates, but 4th in PPP terms Source: Calculated from IMF, International Financial Statistics.
How is this income earned? Who earns it? Who produces more per worker: farmersor other workers? …in poor countries? …in the U.S.?
What about poverty? …Commonly defined as <$1/day, in PPP terms Source: Martin Ravallion, Shaohua Chen and Prem Sangraula, “New Evidence on the Urbanization of Global Poverty.” World Bank Policy Research Working Paper 4199, April 2007. The number of urban poor has risen due to rural-urban migration, but the prevalence of poverty in both rural and urban areas has declined.
Has health improved over time? Source: Computed from UN Population Division, 2004 <http://esa.un.org/unpp> Slide 12
Source: Angus Deaton, “Health, Inequality, and Economic Development.” Journal of Economic Literature, XLI(1), March 2003: 113–158. Note: Circle size is proportional to population. How does health change with income? Slide 13
Poverty and Health To see this relationship, there’s nothing better than gapminder’s view of the world: Click image to open www.gapminder.org/world.
Now, let’s add in nutrition:Our textbook picture Note: availability = production ± trade
Undernutrition is falling, except in Africa Data and projections on childhood underweight, 1995-2015 Slide 17
Children being underweight from too little food is still the world’s worst health threat Slide 18
The shortfall leading to underweight occurs between 4 and 14 months of age Mean weight-for-age z scores, relative to the NCHS reference Latin America Asia Africa Source: R. Shrimpton et al., 2001. “Worldwide Timing of Growth Faltering: Implications for Nutritional Interventions” Pediatrics 107:e75. Reprinted from W.A. Masters (2005), “Paying for Prosperity. JIA 58(2): 35-64. Slide 19
Risk factors vary by income level Contribution to global burden of disease by risk factor and region Slide 21
Some conclusions onpoverty, health and nutrition • Nutrition and health have improved greatly in recent years, in all regions except Africa • …but undernutrition remains the world’s greatest single health risk factor, by affecting preschool children. • The recent food price spike could have worsened malnutrition and health, but income matters even more. • Up next: how prices and income affect consumption