FOSSIL FUELS I
FOSSIL FUELS I PETROLEUM Approximately 84% of the energy used in the US comes from fossil fuels Oil and Natural Gas (Petroleum) Coal Oil Shale and Tar Sand Nonrenewable Resource (Fuel) Formation Process Formation takes 10’s to 100’s of million years.


FOSSIL FUELS I
E N D
Presentation Transcript
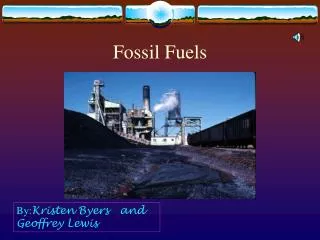
FOSSIL FUELS I PETROLEUM
Approximately 84% of the energy used in the US comes from fossil fuels • Oil and Natural Gas (Petroleum) • Coal • Oil Shale and Tar Sand • Nonrenewable Resource (Fuel)
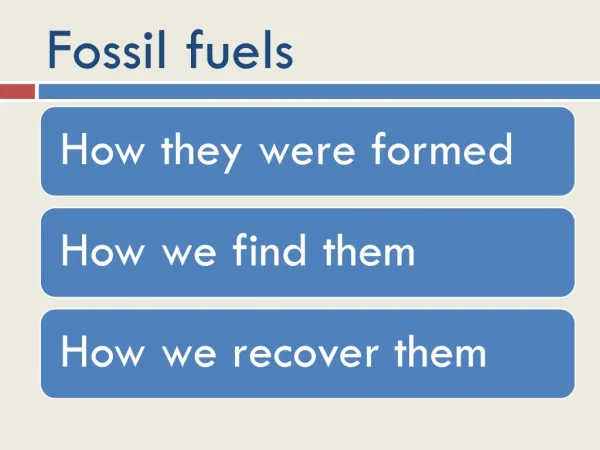
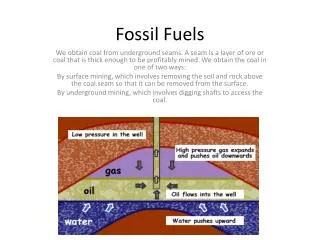
Formation Process • Formation takes 10’s to 100’s of million years. • Dead plants and Animals accumulate on ancient sea floor. • Sandstone layer forms over source bed. • High Pressure and Temperature results in a loss of Oxygen in the compounds
Results in various hydrocarbons (organic compounds with mostly Hydrogen and Carbon in them…more later). These can be solid liquid or gas. • Liquid and gas migrate through porous rock layer (sand stone) until they get caught in a trap or escape.
Types of Oil Traps Fold Salt Dome
Typical Deposit • A few miles across • Approximately 1 mile down (sometimes more. VERY HARD TO FIND
Tools for Searching for Deposits • Gravitational/Magnetic Anomalies Easy to do over a wide area, but is a very coarse measurement. Good to pick out regions for further study • Geological Survey Look at the rocks and minerals in the region. Certain types are indicative of hydrocarbon deposits.
Seismic Survey • Gives a detailed picture of the subsurface • Very expensive • Used over limited but promising areas.
Eventually you must drill a wildcat well. (1st well in a region.) • Even with all of the research, only 1 out of 9 wildcat wells results in a commercially viable well. • Historically, it takes about 11 years for a new discovery to begin producing. • Oil Drilling Video
Which of the following is not a typical oil trap • Fault • Fold • Fracture • Salt Dome
Production • Primary Recovery gets 15% of oil • Secondary Recovery (pumping water down the well) gets another 20%. • 65% is still down there.
Enhanced Production • Much more expensive • Works by reducing surface tension and viscosity of the oil
Enhanced Production Methods • Pump in pressurized Carbon Dioxide to reduce viscosity • Pump in steam to reduce viscosity • Add detergent to reduce surface tension with surrounding rock (then flood with water.
What is in Oil Hydrocarbons, These are the Alkanes CnH2n+2 The proportion of hydrocarbons in the petroleum mixture is highly variable between different oil fields and ranges from as much as 97% by weight in the lighter oils to as little as 50% in the heavier oils and bitumens.
Generally we must treat oil from the ground • Fractional: Distillation: The vapors of different hydrocarbons condense at different temperatures .
Problem: Generally have too many heavy compounds and not enough light ones. • Solution: Break apart long hydrocarbons into shorter pieces. • Two techniques: • Cracking: uses high pressure and temperature • Catalytic conversion: pass petroleum over an Al-Si mixture:
One barrel contains 42 gallons of crude oil. The total volume of products made from crude oil based origins is 48.43 gallons on average - 6.43 gallons greater than the original 42 gallons of crude oil. This represents a "processing gain" due to the additional other petroleum products such as alkylates are added to the refining process to create the final products. Additionally, California gasoline contains approximately 5.7 percent by volume of ethanol, a non-petroleum-based additive that brings the total processing gain to 7.59 gallons (or 49.59 total gallons).
You can also form long hydrocarbon chains by combining light ones • Important for forming material such as nylon, rayon and plastics.
Fun Fact to know and tell… The refining of oil is a very energy intensive process. Approximately 7.5% of the total US energy consumption goes into running oil refineries.
Gasoline Octane Rating • Normal Gas is composed of hydrocarbons with 5-10 Carbon atoms • Each one burns differently • Octane: C8H18 is a standard for comparison, it burns very smoothly. • Heptane: C7H16 burns explosively, causes inefficiency and engine “knock”
Octane rating • Pure Octane: 100 • Pure Heptane: 0 • 90% Oct, 10% Hep 90 Using additives we may also produce a fuel with the same level of “engine knock” as a given Octane-Heptane mix. This is given the same octane rating (tetraethyl lead was the old additive… it is now illegal.)
Burning of Gas • Ideal • 2C8H18 + 25O2 16 CO2 + 18H2O + energy • Gas + Air Carbon Dioxide + Water + energy • The CO2 by burning fossil fuels is generally believed to be causing significant changers to the earth’s climate.
More realistic 2C8H18 + 25O2 14 CO2 + 2CO + O2 + 18H2O + energy. In addition, since there is Nitrogen in the air we get nitrous oxides (big part of smog) NOx N2 +2O2 2NO2 N2 +O2 2NO
WORLD & US OIL RESERVES 2003 • WORLD 1213 billion barrels • US 23 billion barrels (1.9%) • Lifetime of US supply based on Rate equation at 2003 production rate: 10yrs
Proven Reserves (Oct 2009) The US is number 12 with21.3 bbl (1.58%)
Net Difference Between Annual World Oil Reserves Additions and Annual Consumption.
Hubbert Analysis • In 1956 Hubbert predicted US oil production would peak in late 60’ or early 70’s. • It peaked in 1970.
Table II-1. Projections of the Peaking of World Oil Production.
What about ANWR? The Alaska National Interest Lands Conservation Act (1980) established the Arctic National Wildlife Refuge (ANWR). In section 1002 of that act, Congress deferred a decision regarding future management of the 1.5-million-acre coastal plain in recognition of the area’s potentially enormous oil and gas resources and its importance as wildlife habitat. A report on the resources, including petroleum, of the 1002 area was submitted to Congress in 1987 by the Department of the Interior (DOI). Since completion of that report, numerous wells have been drilled and oil fields discovered near ANWR, new geologic and geophysical data have become available, seismic processing and interpretation capabilities have improved, and the economics of North Slope oil development have changed significantly.
What about ANWR? The government estimates up to 16 billion barrels of oil in ANWR are technically recoverable, although much of that would be too expensive to produce at today's prices. With prices were at or above $35 a barrel, energy companies could economically recover an estimated 6 billion barrels of oil from ANWR. Note: the US use about 7.5 billion barrels of oil per year.
Should ANWR be opened up to oil drilling • Yes • No