Download

1 / 10
0 likes | 15 Vues
Supp Figure 1. A. PR. ER. GR. T47D. MCF7. 10x. B. AR. GR. PR. MR. T47D. MCF7.

E N D
Supp Figure 1 A PR ER GR T47D MCF7 10x B AR GR PR MR T47D MCF7 Supplementary Figure 1. Expression of hormone receptors in cultured T47D and MCF7 cells. A) Immunocytochemistry of estrogen receptor-α (ERα), progesterone receptor (PR), or glucocorticoid receptor (GR). Green stain – hormone receptor expression; blue stain (nuclei; DAPI). B) Immunohistochemistry of formalin-fixed, paraffin-embedded pellets of cultured T47D and MCF7 cells stained for estrogen receptor-α (ERα), progesterone receptor (PR), or glucocorticoid receptor (GR). Red stain – hormone receptor expression; green stain – cytokeratin; blue stain – DAPI (nuclei).
Supp Figure 2 A MCF7 T47D *** 8 4 **** *** 6 3 *** % CK5+ cells (FITC+) % CK5+ cells (FITC+) 4 2 2 1 0 0 0 0.1 1 10 0 0.1 1 Dexamethasone (µM) Dexamethasone (µM) B Veh 1µM 10µM 10x T47D, CK5/Dapi Supplementary Figure 2.A) Induction of CK5+ cells in cultured T47D and MCF7 lines in response to increasing concentrations of Dex for 6 days. B) Representative images of immunocytochemistry for CK5 in T47D cultures exposed to 0, 1 or 10 µM Dex for 6d.
Supp Figure 3 T47D MCF7 Veh 8 15 **** RU-486 *** **** 6 10 % CK5+ cells (FITC+) % CK5+ cells (FITC+) 4 Veh RU-486 5 2 0 0 Veh Dex Prg Ald Veh Dex Prg Ald Supplementary Figure 3. Flow cytometric analysis of CK5+ cells (percent) in T47D (left) and MCF7 (right) cultures treated with Veh, Dex, Prg or Ald in the absence and presence of RU-486 for 6 days. Mean ± SEM are shown.
MCF7 15 10 %CK5+ cells (FITC+) 5 0 0d 2d 5d Supp Figure 4 B A *** 10 100 2d **** 5d 8 80 *** 6 60 % CK5+ cells (FITC+) Number of CK5+ clusters 4 40 * * 2 20 0 0 0d 1d 4d 6d 1 2 3 4 5 6 >7 Number of CK5+ cells per cluster Dexamethasone (days) C Dex 0d 2d 5d 40x T47D, CK5/Dapi D E T47D ** Veh 20 Dex 15 * CK5 mRNA (Fold induction) * 10 5 0 4hr 16hr 24hr 48hr Supplementary Figure 4. Time course of glucocorticoid-induction of CK5+ cells in T47D and MCF7 cell cultures. A) Flow cytometric analysis of % CK5+ cells in T47D cultures continue to increase through 6 days. CK5+ cells expand in clusters with larger clusters appearing by Day 5 compared to Day 2 as quantified in (B) with representative immunocytochemistry images showing CK5 (red) and DAPI (blue) (C). Flow cytometric analysis of % CK5+ cells in MCF7 cultures showing rapid Dex-induction of CK5+ cells as early as 2 days (D). qRT-PCR analysis of time course of Dex induction of CK5 transcripts in T47D cultures.
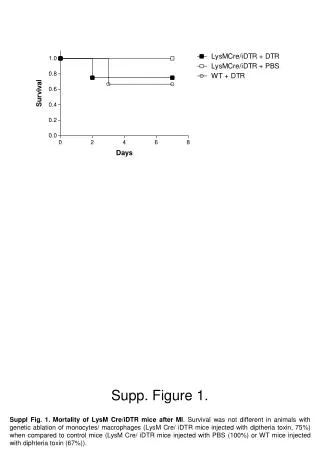
Supp Figure 5 800 Tam-resistant tumors 600 Ctrl tumors Tumor volume (mm2) 400 200 Tamoxifen 0 100 10 20 30 40 50 60 70 80 90 Time (Days) Supplementary Figure 5. T47D cell tumor xenograft growth data prior to (Ctrl) and post- (Tam) tamoxifen treatment in mice. Xenografts were allowed to establish until day 40 (Ctrl tumors; red arrow), when half of the mice were sacrificed and tumors collected for CK5 staining (n=5). The remaining mice (n=5) then received slow release tamoxifen pellets (10mg/90 day release) s.c. on Day 45 through Day 105, at which time the mice were sacrificed and tamoxifen-resistant tumors (blue arrow) collected for CK5 staining.
Supp Figure 6 D A B Bcl6 Bcl6-shRNA-1 T47D MCF7 Bcl6-shRNA-2 Bcl6 Bcl6 - + + + + + GAPDH Dex GAPDH 0 0.01 0.03 0.1 0.3 1 3 10 Dex (h) 0 4 8 16 24 48 Dex (μM) Bcl6 NTC ShRNA C MCF7 CK5/Bcl6 20x Dex Veh Supplementary Figure 6.A) Dose-dependent induction of BCL6 protein by dexamethasone in T47D cell cultures by western blot. B) Time course of Bcl6 protein expression in MCF7 cells treated with Dex. C) Representative image showing induction of Bcl6 (green) and CK5 (red) in MCF7 cells. D) Western blot showing efficacy of Bcl6 protein knockdown in T47D cells treated with or without dexamethasone by increasing doses of two independent shRNAs delivered by lentiviral infection. NTC – non-target control shRNA.
Supp Figure 7 A Bcl6 GAPDH T47D MCF7 ZR75.1 C Bcl6 pStat5 - + - - + + - + Dex Veh - - - + - + + + Prl Dex B Prl Bcl6 Dex Dex/Prl GAPDH Bcl6 Time (h) 0 1 8 16 24 48 72 0 1 8 16 24 48 72 Ald GAPDH - - + + + + + + + Steroid - - 4 9 20 0.4 0.9 2 20 Prl (nM) D Bcl6 MCF7 GAPDH 0 0.01 0.03 0.1 0.3 1 3 10 0 0.01 0.03 0.1 0.3 1 3 10 Dex(µM) Bcl6 T47D GAPDH 0 0.001 0.003 0.01 0.03 0.1 0.3 1 0 0.001 0.003 0.01 0.03 0.1 0.3 1 Ald(µM) Veh Prl Supplementary Figure 7. Prolactin effectively suppresses basal and 3-ketosteroid-induced Bcl6 protein in various ERα+ human breast cancer cell lines. Western blot showing effective knockdown of basal and Dex-induced Bcl6 protein in T47D, MCF7 and ZR75.1 cultured cell lines (A). Western blot showing effective knockdown of basal Bcl6 protein or Bcl6 protein induced by Dex or Ald in T47D cells (B). Western blot showing sustained knockdown of basal Bcl6 protein or Bcl6 protein induced by Dex in T47D cells, with parallel sustained tyrosine phosphorylation of Stat5 (C). Western blot showing effective knockdown of Bcl6 protein even at high doses of Dex (upper panels) or Ald (lower panels) in MCF7 cells (D).
Supp Figure 8 A T47D Veh Prl Dex Dex+Prl Prg Prg+Prl Ald Ald+Prl DHT DHT+Prl Est Est+Prl 3 0 3 4 5 3 0 3 4 5 -10 10 10 10 -10 10 10 10 α-CK5 (Alexa Fluor-488) α-CK5 (Alexa Fluor-488) C B T47D MDA-MB-231 Veh 15 10 Veh Prl Prl 8 EGF 10 Prl+EGF 6 % CK5+ cells (FITC+) % CK5+ cells (FITC+) 4 5 2 0 0 Veh Dex Prg Ald Veh Dex Prg Ald DHT Est Supplementary Figure 8. Representative flow cytometry data showing reversal of CK5 induction by 3-ketosteroids Dex, Prg, Ald and DHT by prolactin cotreatment in T47D cells (A). Flow cytometry data documenting effective suppression of Dex-induced CK5 cell population in T47D cells by prolactin but not EGF (B). Flow cytometry data showing that the ERα-negative mesenchymal cell line MDA-MB-231 does not respond to 3-ketosterids with CK5+ cell induction and also shows absence of suppressive prolactin response (C).
Supp Figure 9 A Luminal A Luminal B *** 5.0 * *** CK5 4.5 ER PR 4.0 Her2+ TNBC 3.5 Relative Quantitative Expression (log) 3.0 2.5 20x p <0.001 p <0.05 *** GR/CK/DAPI 2.0 B ERα+/CK5-/Ki67hi ERα+/CK5+ ERα+/CK5-/Ki67lo * Supplementary Figure 9. Representative images of GR expression in breast cancer subtypes by immunofluorescence staining. GR (red), pan-cytokeratin (green), and DAPI (blue) (A). Relative quantitative expression of ER, PR and CK5 in ER+ breast cancer subgroups ER+/CK5-/Ki67lo (Luminal A-like), ER+/CK5-/Ki67hi (Luminal B-like), and ER+/CK5+ (Luminobasal-like) (B).
Supp Figure 10 A 1 CK5 < ≥ 6.465 6.465 2 CK5 ≥ 9.537 9.537 < 3 BCL6 ≥ < 8.019 8.019 4 BCL6 < ≥ 8.952 8.952 5 12 CK5 BCL6 ≥ ≥ < 7.233 < 7.233 9.069 9.069 6 13 CK5 BCL6 ≥ < ≥ 7.684 7.684 9.124 9.124 < 8 15 BCL6 BCL6 ≥ < ≥ 8.556 8.556 9.615 9.615 < n = 9 n = 22 n = 20 n = 23 n = 8 n = 10 n = 32 n = 13 n = 8 n = 13 n = 12 1 1 1 1 1 1 1 1 1 1 1 0.8 0.8 0.8 0.8 0.8 0.8 0.8 0.8 0.8 0.8 0.8 0.6 0.6 0.6 0.6 0.6 0.6 0.6 0.6 0.6 0.6 0.6 0.4 0.4 0.4 0.4 0.4 0.4 0.4 0.4 0.4 0.4 0.4 0.2 0.2 0.2 0.2 0.2 0.2 0.2 0.2 0.2 0.2 0.2 0 0 0 0 0 0 0 0 0 0 0 0 4 8 12 0 4 8 12 0 4 8 12 0 4 8 12 0 4 8 12 0 4 8 12 0 4 8 12 0 4 8 12 0 4 8 12 0 4 8 12 0 4 8 12 L L H H L L H H H H H B 1 CK5 < ≥ 1565.717 1565.717 2 CK5 < 940.119 ≥ 940.119 4 CK5 ≥ < 813.704 813.704 5 CK5 ≥ < 750.706 750.706 7 BCL6 ≥ < 3719.381 3719.381 9 CK5 < ≥ 637.166 637.166 10 BCL6 < ≥ 8755.707 8755.707 n = 13 n = 24 n = 9 n = 10 n = 14 n = 74 n = 17 n = 9 1 1 1 1 1 1 1 1 0.8 0.8 0.8 0.8 0.8 0.8 0.8 0.8 Supplementary Figure 10. Recursive partitioning regression tree models were developed for CK5 and BCL6 mRNA expression levels (A) or CK5 and BCL6 protein expression levels (B) where splitting decisions are based on optimization of the log-rank statistic, and plotted using partykit package in R. End nodes are then amalgamated based on homogeneity of hazard ratio, here labeled as L (low) and H (high). 0.6 0.6 0.6 0.6 0.6 0.6 0.6 0.6 0.4 0.4 0.4 0.4 0.4 0.4 0.4 0.4 L L L L L H H H 0.2 0.2 0.2 0.2 0.2 0.2 0.2 0.2 0 0 0 0 0 0 0 0 0 100 200 0 100 200 0 100 200 0 100 200 0 100 200 0 100 200 0 100 200 0 100 200