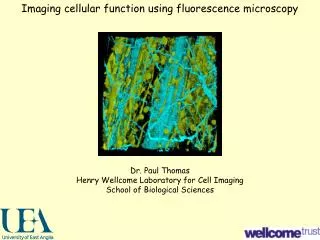
Imaging cellular function using fluorescence microscopy
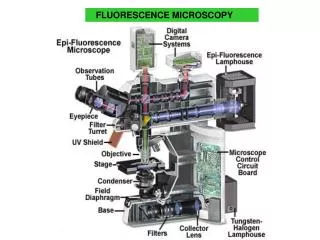
Imaging cellular function using fluorescence microscopy. Dr. Paul Thomas Henry Wellcome Laboratory for Cell Imaging School of Biological Sciences. Henry Wellcome Laboratory for Cell Imaging. 4 widefield fluorescence microscopes: Invert with CO 2 incubator Invert with microinjector

Imaging cellular function using fluorescence microscopy
E N D
Presentation Transcript
Imaging cellular function using fluorescence microscopy Dr. Paul Thomas Henry Wellcome Laboratory for Cell Imaging School of Biological Sciences
Henry Wellcome Laboratory for Cell Imaging • 4 widefield fluorescence microscopes: • Invert with CO2 incubator • Invert with microinjector • Upright with HiRes camera • Stereo with HiRes camera • 2 confocal microscopes: • Leica TCS SP2 UV • Zeiss LSM510 META • 1 multi-photon microscope: • LaVision BioTec TriMscope • with lifetime imaging detector • Analysis facilities: • Cell / organelle tracking • 3D reconstruction • Time series / 4D quantification • Image restoration / Deconvolution Tibialis anterior containing pericytes expressing YFP with muscle and collagen fibres imaged using Second Harmonic Generation
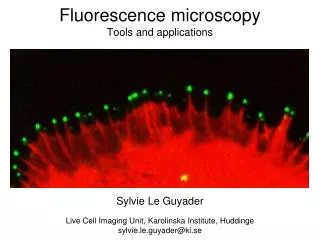
Transmitted-light and Fluorescence imaging Eastern Sea Fisheries Illegally-scrubbed lobster pleopods Salmonella-infected epithelial cell Epicardial cells from an explant of neonatal heart Nitric oxide generation during bacterial killing in a macrophage
Quantification – Intensity analysis and object identification
Measurement of intracellular ion concentrations: Proton concentrations in endo/lysosomal compartments pH 3.5 pH 4.5 pH 5.5 pH 6.5
Dynamic measurement of intracellular ion concentrations: Calcium concentrations during agonist stimulation Ratio F/F0
Tracking objects: Autophagosomal movements during cell starvation
Automated tracking: Cell migration during embryo development
Recent addition: A multi-photon microscope with a mode-locked, Ti:Sapphire laser Advantage 1: Long wavelengths = Less scattering of light; therefore, deeper penetration of tissues Advantage 2: Short pulse width (~100 fs) = Increased statistical chance of two or more photons arriving in the same place at the same time - 2-3 long-wavelength photons = 1 short-wavelength photon Advantage 3: Excitation only at the focal point; i.e., no photodamage in out-of-focus regions Courtesy of Graham Ellis-Davies, Drexel University, Philadelphia
Fluorescence Lifetime IMaging (FLIM) Typical fluorophore lifetimes ~2 ns FLIM provides a spatial map of cellular activity
Services provided (charges subject to negotiation) 1. Self-run experiments on microsopes (training provided): Widefield, confocal and overnight timelapse experiments 2. Experiments run by laboratory personnel (no sample preparation, no analysis): All microscopes including multi-photon/FLIM 3. Experiments run by laboratory personnel, inc. sample preparation (no analysis): All microscopes including multi-photon/FLIM 4. All-inclusive service run by laboratory personnel: All microscopes including multi-photon/FLIM Contact: Dr. Paul Thomas, Director,The Henry Wellcome Laboratory for Cell Imaging,School of Biological Sciences,University of East Anglia,Norwich,NR4 7TJ.e-mail: p.thomas@uea.ac.ukTel: (01603) 592196Fax: (01603) 592250Imaging web-site: http://www.uea.ac.uk/bio/biobmi/