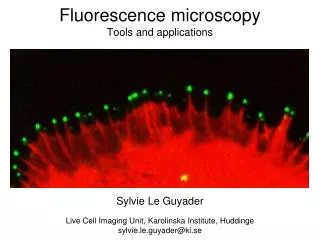
Quantitative Fluorescence Microscopy
Quantitative Fluorescence Microscopy. Ana González Wusener Instituto de Investigaciones Biotecnológicas IIB-INTECH Universidad Nacional de General San Martín.

Quantitative Fluorescence Microscopy
E N D
Presentation Transcript
Quantitative Fluorescence Microscopy Ana González Wusener Instituto de Investigaciones Biotecnológicas IIB-INTECH Universidad Nacional de General San Martín
“Protein functions are regulated in an integrated network, which is the result of the integration of protein transport, posttranslational modifications and specific interactions, which occurs in different subcellular compartments at different time scales...” The spatial localization of a protein in the cell is the first step to integrate it in the complex cell network.
The light microscope has been used to document the localization of fluorescent molecules in cell biology research. With advances in digital cameras and the discovery and development of genetically encoded fluorophores, there has been an increase in the use of fluorescence microscopy to quantify spatial and temporal measurements of fluorescent molecules in biological specimens. What information is present in a fluorescence microscopy digital image? The intensity value of a pixel is related to the number of fluorophores present at the corresponding area in the specimen. We can use digital images to extract two types of information from fluorescence microscopy images: (1) spatial, which can be used to calculate distances, areas, and velocities (2) intensity, which can be used to determine the local concentration of fluorophores in a specimen.
Signal, background, and noise In quantitative fluorescence microscopy, we want to measure the signal coming from the fluorophores used to label the object of interest in our specimen. Backgroundadds to the signal of interest: Intensity values in the digital image = Signal + Background ! To accurately and precisely measure the signal of interest, background should be reduced as much as possible, and must be subtracted from measurements.
Noise causes variance in the intensity values above and below the “real” intensity value of the signal plus the background To detect the presence of a signal, the signal must be significantly higher than the noise level of the digital image. The precision of quantitative microscopy measurements is limited by the signal-to-noise ratio (SNR) of the digital image. SNR affects spatial measurements and intensity measurements
Maximizing signal The intensity of the signal in digital fluorescence microscopy images is affected by every step along the path to quantitation, including: The specimen: - Choose a brighter and more photo-stable fluorophore - Fixed specimens should be mounted in a glycerol-based mounting medium that contains an anti-photobleaching inhibitor The microscope: - Use illumination wavelengths that will optimally excite the fluorophore - The numerical aperture (NA) of the objective lens is an important determinant of the brightness of the optical image - Spherical aberration is reduced by mounting fixed specimens in a mounting medium with a refractive index similar to that of the immersion medium
The detector: - Increasing the exposure time allows the flux of photons coming from the specimen to accumulate (as electrons) in the detector, increasing the intensity values in the image up to a point. Detectors have a limited capacity to hold electrons; if this capacity is reached, the corresponding pixel will be “saturated” and any photons reaching the detector after saturation will not be counted. The linearity of the detector is lost. Saturated images cannot be used for quantitation of fluorescence intensity values - Binning on the CCD chip increases the intensity of the pixels without increasing readout noise, resulting in a higher SNR digital image. However, because the resulting pixels represent a larger area of the specimen, binning decreases the resolution of the digital image. 2x2 camera binning 4x4 camera binning No camera binning
Background fluorescence reduces dynamic range and decreases SNR Dynamic range of a CCD camera is defined as the full well capacity of the photodiodes (i.e., the number of photons that can be detected per pixel before saturation) divided by the detector noise. Photons from background sources fill the detector, limiting the number of signal photons that can be collected before the detector saturates and effectively decreasing dynamic range. Detector noise Thermal noise is caused by the stochastic generation of thermal electrons within the detector, and is largely eliminated by cooling. Read noise is generated by the amplifier circuitry used to measure the voltage at each pixel, and is usually the dominant source of noise in standard cooled CCD cameras designed for quantitative imaging. Read noise is usually expressed in the manufacturer’s technical specifications as a number of electrons. ! Noise is not a constant, so it cannot be subtracted from a digital image.
Resolution In digital microscopy, spatial resolution is defined by: - the microscope - the detector It limits our ability to accurately and precisely locate an object and distinguish close objects as separate from one another: Resolution in the optical image. Distance by which two objects must be separated in order to distinguish them as separate from one another, which is equal to the radius of the smallest point source in the image (defined as the first minimum of the airy disk) r = (0.61)λ NA Resolution in the digital image. The resolution of a digital image acquired with a CCD camera depends on the physical size of the photodiodes that make up the chip. The pixel size should be at least two times smaller than the resolution limit of the microscope optics, so that the smallest possible object in the image (defined as the diameter of the airy disk) will be sampled by 4 pixels.
Resolution Signal intensity • Magnification decreases image intensity • Smaller pixels generally collect fewer photons To compensate for loss of signal due to smaller pixel size, longer camera exposure times or more intense illumination may be necessary. If the pixel size is too large, the optical image will be under-sampled and detail will be lost in the digital image.
Additional threats to accuracy and precision in quantitative microscopy Non-uniform illumination Uneven illumination can be detrimental to quantitative measurements because it may cause the intensity of an object in one area of the field of view to measure differently than the intensity of an object of equal fluorophore concentration in another area of the field of view. To reduce uneven illumination, the wide-field fluorescence microscope should be aligned.
Bleed-through Bleed-through of one fluorophore’s emission through the filter set of another fluorophore can occur when a specimen is labeled with multiple fluorophores whose excitation and emission spectra overlap. Avoid bleed-through by carefully choosing fluorophores and filter sets.
Photobleaching The rate of photobleaching is specific to the fluorophore, its environment, and the intensity of the illuminating light. FITC phalloidin AlexaFluor 488 phalloidin Antiphotobleaching reagents can be added to the mounting medium to reduce the rate of photobleaching.
Image processing and storage Some types of image processing and storage can change the relative intensity values in a digital image, rendering them unusable for quantitative measurements. Analysis of pixel intensity values should be done on raw images stored without further scaling or processing, or on images that have been corrected using methods that have been demonstrated to preserve the linear relationship between photons and image intensity values (e.g., flat-field corrected 16-bit TIFF images are a good choice for quantitation). TIFF image JPEG image
Signal and background in an image LOD = Limit of Detection Pixels whose grey value is greater than LOD are significantly different from background (Bg) For fluorescent labeled cells, background would be better measured in unlabeled cells. If this is difficult to achieve, one can measure background from an empty region. LOD signal=Bg average+ 3SD Bg
File / Open Create an Area Selection in an empty region with the Rectangle Area Selection Tool Add the area selection to ROI (“t”) Plugins / ROI / BG Substraction from ROI
Gray Value Gray Value Distance (pixels) Distance (pixels) Create a Line Selection Add the area selection to ROI (“t”) Analyze/ Plot Profile Displays a two-dimensional graph of the intensities of pixels along a line within the image. The x-axis represents distance along the line and the y-axis is the pixel intensity.
Threshold mask For quantitative analysis we must only take significant pixels from the microscope image. How can we select them: Threshold mask Defining a correct threshold is not an easy issue. T.L. (Threshold level) = Bg + 3SDBg Use this tool to set lower and upper threshold values, segmenting the image into features of interest and background. The thresholded features are displayed in red and background is displayed in grayscale. Image/Adjust/Threshold
Substract background • Create an Area Selection in an empty region with the Rectangle Area Selection Tool • Add the area selection to ROI (“t”) • Plugins / ROI / BG Substraction from ROI • Measure average fluorescence intensity of cell background • Create a Line Selection • Add the area selection to ROI (“t”) • Analyze/ Plot Profile • Copy and Paste in Microsoft Office Excel Book • Calculate average value • Threslhold Level = Bg + 3 x SDBg • Image/ Adjust / Threslhold • Edit / Selection / Create Selection • Add the created selection to ROI (“t”)
Colour Image processing Images can have colour in three ways: Pseudocolour A pseudo-coloured image is a single channel, (i.e. grey) image that has colour ascribed to it via a “look up table” or LUT (palette, colour table). This is a table of grey values (zero to 256 or 4095 whether 8-bit or 12-bit grey) with accompanying red, green and blue values. So instead of displaying a grey, the image displays a pixel with a defined amount of each colour. Differences in colour in the pseudo-coloured image reflect differences in intensity of the object rather than differences in colour of the specimen that has been imaged. Image/Lookup Tables/Green
24-bit RGB images The colours in RGB images (24-bit, 8-bits for each of the red, green and blue channels) are designed to reflect genuine colours, i.e. the green in an RGB image reflects green colour in the specimen, the differences in intensity of the green reflects differences in intensity of green in the specimen. Another option would be to use Magenta rather than red in red-green-blue merge. RGB Image/Colour/RGB Merge Plugins/Colour Functions/Recolor RGB to MGB MGB
Colour Composite Images • A colour composite handles colour images in 'layers', which ImageJ calls "channels". • The advantages with this type of image over RGB images are: • Each channel is kept separate from the others and can be turned on and off vial the 'Channels' dialog . • Each original channel can be kept as 16-bit. • More than 3 channels can be merged and kept separate. • The contrast and brightness of individual channels can be adjusted after merging. • Image/Colour/MakeComposite
Merging multi-channel images RGB colour merging The ImageJ function Image/Colour/RGB mergecan be used to merge red, green and/or blue channel images or Image Stacks This reduces 16-bit images to 8-bits (based on the current Brightness and Contrast values) then generates a 24-bit RGB image. An alternative to the normal Red-Green merge is to merge the images based on Cyan and Magenta, or Cyan-Yellow or any other colour combination. Plugins/Colour Functions/Colour merge
Merging transmitted light and fluorescence images Fluorescence and transmitted light brightfield images can be merged with the function: Plugins/Colour Functions/RGB-Grey Merge
Splitting multi-channel Images RGB 24-bit An RGB image or stack can be split to the respective red, green and blue image components using the menu command Image / Colour/ RGB split. Running this command with the Alt-key down keeps the original RGB image/stack. The plugin Plugins/Colour Functions/RGB to Montage works with single slice RGB images. A new RGB stack is created. ColourComposite The composite can be reverted to a greyscale stack via the menu command Image/Hyperstacks/Hyperstack to Stack. The channels can be subsequently split to individual images via the menu command Image/Stacks/Stack to Images.
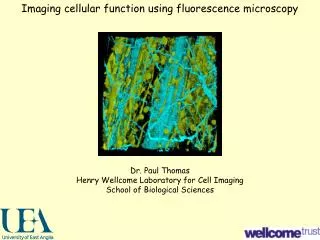
GFP-α actinina Vinculina (AlexaFluor 568)
GFP-α actinina Vinculina (AlexaFluor 568)
An adherent culture of Swiss mouse embryo cells (3T3) was immunofluorescently labeled with primary anti-vinculin mouse monoclonal antibodies followed by goat anti-mouse Fab heavy and light chain fragments conjugated to Cy3 (red emission). In addition, the specimen was simultaneously stained for DNA with the ultraviolet-absorbing probe Hoechst 33342, and for the cytoskeletal filamentous actin network with Alexa Fluor 488 conjugated to phalloidin. The culture of A-10 myoblasts was immunofluorescently labeled with anti-vinculin mouse monoclonal primary antibodies followed by goat anti-mouse IgG secondary antibodies conjugated to Alexa Fluor 647 (pseudocolored blue). In addition, the specimen was stained for DNA with the ultraviolet-absorbing probe Hoechst 33342 (pseudocolored cyan), for the cytoskeletal filamentous actin network with Alexa Fluor 488 conjugated to phalloidin, and for mitochondria with MitoTracker Red CMXRos. A culture of Indian Muntjac fibroblast cells was transfected with a DsRed-Mitochondria plasmid subcellular localization vector to target cellular mitochondria. Stable transfectants were isolated and grown into log phase before being fixed, permeabilized, and labeled with DAPI and Alexa Fluor 488 conjugated to phalloidin, targeting DNA in the cell nucleus and the F-actin cytoskeletal network, respectively. The nuclei of embryonic Swiss mouse fibroblasts in culture were targeted with the nucleic acid probe DAPI. In addition, the cells were also stained with Alexa Fluor 488 conjugated to phalloidin (filamentous actin) and MitoTracker Red CMXRos (mitochondria).
A culture of Swiss mouse embryo cells was immunofluorescently labeled with primary anti-vinculin mouse monoclonal antibodies followed by goat anti-mouse Fab fragments conjugated to Cy3 (yielding red emission). In addition, the specimen was simultaneously stained for DNA with the ultraviolet-absorbing probe Hoechst 33342 (blue emission), and for the cytoskeletal filamentous actin network with Alexa Fluor 488 (green emission) conjugated to phalloidin. Immunofluorescence with mouse anti-alpha-tubulin was employed to visualize distribution of the microtubule network in a log phase monolayer culture of African water mongoose skin cells. The secondary antibody (goat anti-mouse IgG) was conjugated to Alexa Fluor 568 and mixed with Alexa Fluor 488 conjugated to phalloidin to simultaneously image tubulin and the actin cytoskeleton. Nuclei were counterstained with Hoechst 33258. Nuclei of 3T3 cells grown in culture were stained with the fluorophore DAPI and imaged utilizing a combination of fluorescence and phase contrast illumination.