Download

1 / 26
260 likes | 447 Vues
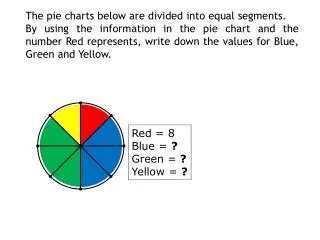
The pie charts below are divided into equal segments. By using the information in the pie chart and the number Red represents, write down the values for Blue, Green and Yellow. Red = 8 Blue = ? Green = ? Yellow = ?. Red = 4 x Blue = ? Green = ? Yellow = ?. Red = 12 Blue = ?

E N D
The pie charts below are divided into equal segments. By using the information in the pie chart and the number Red represents, write down the values for Blue, Green and Yellow. Red = 8 Blue = ? Green = ? Yellow = ?
Red = 4x Blue = ? Green = ? Yellow = ? Red = 12 Blue = ? Green = ? Yellow = ?
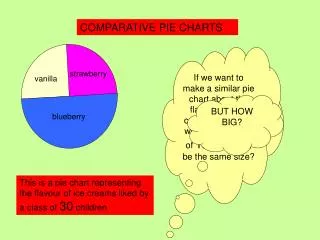
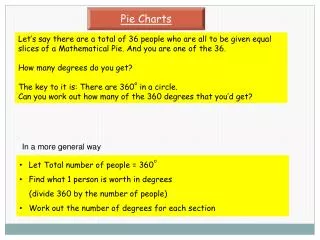
Interpreting Pie Charts Pie charts can be thought of as circlegraphs. To calculate the quantities represented by each slice of the pie chart we need to take the angular fraction of the given total. A drinks machine dispenses 540 drinks on a Monday. The information is displayed in the pie chart. Use the information to find the number of each drink sold. 360o Tea Coffee 108o 84o 24o Milk 60o 36o 48o Cola Chocolate Squash
Interpreting Pie Charts Favourite Sport In a survey, 300 people were asked to indicate which one of five sports they liked best. The information is displayed in the pie chart. Calculate the number of people who chose each sport. Rugby Football Cricket Ice Hockey Squash Total 300 Football Rugby 90o 108o 36o Squash 54o 72o Cricket Ice Hockey 75 90 45 60 30
Interpreting Pie Charts Crisp Sales The information in the pie chart shows the sales of 144 packets of crisps from a shop. Calculate the number of each type sold. Plain Chicken Salt & V Cheese & On Smokey Bacon Total 144 Plain Chicken 40o 115o 55o Salt & V 85o 65o Smokey Bacon Cheese & On 46 16 22 26 34
Worksheet 1 1 2 300 people asked 144 packets sold Football Plain Rugby Chicken 40o 115o 90o 108o 55o Salt & V 36o 85o Squash 54o 65o 72o Smokey Bacon Cricket Cheese & On Ice Hockey
Musical Instruments Drawing Pie Charts Musical Instrument In a survey, people were asked to indicate which one of five musical instruments they played. The information is given in the table. Display the information in a pie chart. Guitar 35 Violin 10 Recorder 15 Drum 5 Keyboard 25 Total 90
Drawing Pie Charts Musical Instrument In a survey, people were asked to indicate which one of five musical instruments they played. The information is given in the table. Display the information in a pie chart. Guitar 35 Violin 10 Recorder 15 Drum 5 Keyboard 25 Total 90 Guitar
Drawing Pie Charts Musical Instrument In a survey, people were asked to indicate which one of five musical instruments they played. The information is given in the table. Display the information in a pie chart. Guitar 35 Violin 10 Recorder 15 Drum 5 Keyboard 25 Guitar Total 90
Drawing Pie Charts Musical Instrument In a survey, people were asked to indicate which one of five musical instruments they played. The information is given in the table. Display the information in a pie chart. Guitar 35 Violin 10 Recorder 15 Drum 5 Keyboard 25 Guitar Total 90 Violin
Drawing Pie Charts Musical Instrument In a survey, people were asked to indicate which one of five musical instruments they played. The information is given in the table. Display the information in a pie chart. Guitar 35 Violin 10 Recorder 15 Drum 5 Keyboard 25 Total 90 Violin Guitar
Drawing Pie Charts Musical Instrument In a survey, people were asked to indicate which one of five musical instruments they played. The information is given in the table. Display the information in a pie chart. Guitar 35 Violin 10 Recorder 15 Drum 5 Keyboard 25 Total 90 Recorder Violin Guitar
Drawing Pie Charts Musical Instrument In a survey, people were asked to indicate which one of five musical instruments they played. The information is given in the table. Display the information in a pie chart. Guitar 35 Violin 10 Recorder 15 Drum 5 Keyboard 25 Recorder Violin Guitar Total 90
Drawing Pie Charts Musical Instrument In a survey, people were asked to indicate which one of five musical instruments they played. The information is given in the table. Display the information in a pie chart. Guitar 35 Violin 10 Recorder 15 Drum 5 Keyboard 25 Recorder Violin Guitar Total 90 Keyboard Drum
Drawing Pie Charts Musical Instrument In a survey, people were asked to indicate which one of five musical instruments they played. The information is given in the table. Display the information in a pie chart. Guitar 35 Violin 10 Recorder 15 Drum 5 Keyboard 25 140o 40o 60o 100o 20o Total 90 Guitar Violin Recorder Keyboard Drum
Ice Creams Ice-cream Sales The information in the table shows sales of ice-cream from an ice-cream van one Saturday afternoon in the summer. Display the information in a pie chart. Vanilla 13 Banana 22 Chocolate 28 Strawberry 57 Drawing Pie Charts Total 120
Ice-cream Sales The information in the table shows sales of ice-cream from an ice-cream van one Saturday afternoon in the summer. Display the information in a pie chart. Vanilla 13 Banana 22 Chocolate 28 Strawberry 57 Drawing Pie Charts Total 120 Vanilla
Ice-cream Sales The information in the table shows sales of ice-cream from an ice-cream van one Saturday afternoon in the summer. Display the information in a pie chart. Vanilla 13 Banana 22 Chocolate 28 Strawberry 57 Vanilla Drawing Pie Charts Total 120
Ice-cream Sales The information in the table shows sales of ice-cream from an ice-cream van one Saturday afternoon in the summer. Display the information in a pie chart. Vanilla 13 Banana 22 Chocolate 28 Strawberry 57 Vanilla Drawing Pie Charts Total 120 Banana
Ice-cream Sales The information in the table shows sales of ice-cream from an ice-cream van one Saturday afternoon in the summer. Display the information in a pie chart. Vanilla 13 Banana 22 Chocolate 28 Strawberry 57 Vanilla Banana Drawing Pie Charts Total 120
Ice-cream Sales The information in the table shows sales of ice-cream from an ice-cream van one Saturday afternoon in the summer. Display the information in a pie chart. Vanilla 13 Banana 22 Chocolate 28 Strawberry 57 Vanilla Banana Drawing Pie Charts Total 120 Chocolate Strawberry
Ice-cream Sales The information in the table shows sales of ice-cream from an ice-cream van one Saturday afternoon in the summer. Display the information in a pie chart. Vanilla 13 Banana 22 Chocolate 28 Strawberry 57 Banana Chocolate Vanilla 66o 39o 84o 171o Strawberry Drawing Pie Charts Total 120
Total 36 Use the data in the frequency table to complete the pie chart showing the favourite colours of a sample of people. Drawing pie charts Favourite colour No of people Red 10 Yellow 3 Blue 14 Green 5 Purple 4
Holiday destination No of people UK 74 Europe 53 America 32 Asia 11 Other 10 Total 180 Use the data in the frequency table to complete the pie chart showing the holiday destinations of a sample of people. Drawing pie charts
Worksheets Worksheet 2 Drawing Pie Charts Musical Instrument In a survey, people were asked to indicate which one of five musical instruments they played. The information is given in the table. Display the information in a pie chart. Guitar 35 Violin 10 Recorder 15 Drum 5 Keyboard 25 Total
Worksheet 3 Drawing Pie Charts Ice-cream Sales The information in the table shows sales of ice-cream from an ice-cream van one Saturday afternoon in the summer. Display the information in a pie chart. Vanilla 13 Banana 22 Chocolate 28 Strawberry 57 Total