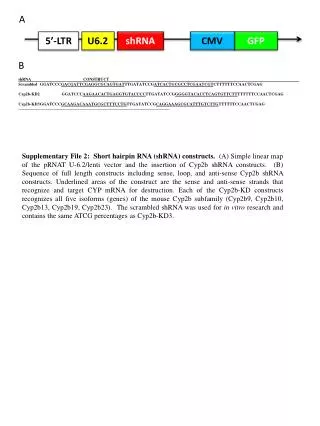
Impact of miR-93 on Breast Cancer Cell Proliferation and Treatment Responses
This study investigates the role of miR-93 in breast cancer, analyzing GFP-positive and negative tumor cells. Utilizing various cell lines (SUM159, HCC1954, MCF7), we examine treatment responses to DOX and Docetaxel. We employed FACS and DAPI staining to assess cell viability and proliferation across different treatments. Our findings reveal the differential effects of miR-93 on stem cell markers and tumor behavior, providing insights into potential therapeutic strategies for overcoming drug resistance in breast cancer.

Impact of miR-93 on Breast Cancer Cell Proliferation and Treatment Responses
E N D
Presentation Transcript
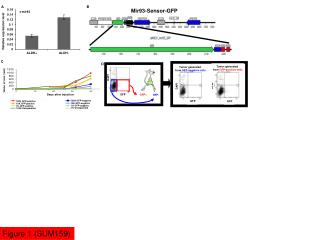
A B Mir93-Sensor-GFP C D 100K GFP-negative 100K GFP-positive 10K GFP-negative 10K GFP-positive 1K GFP-negative 1K GFP-positive 1K Unseparated 100K Unseparated Tumor generated from GFP-positive cells Tumor generated from GFP-negative cells DAPI DAPI DAPI GFP GFP+ GFP- GFP GFP Figure 1 (SUM159)
B A Lung Spine Brain DAPI Annexin V-APC CONTROL DOX 0.13% 4.47% 0.14% 2.09% 0.53% 8.86% 6.78% 51.9% 56.4% 39% 24.2% 66.4% 12.5% 18.9% 52.1% 45.7% DOCETAXEL E C D DOX + DOCETAXEL F H Treatment Start Treatment Stop Treatment Start Treatment Start G Treatment Stop Treatment Start Treatment Start Figure S1 (HCC1954 In vitro, in vivo)
Lung Leg DAPI Annexin V-APC Treatment start Heart Kidney B A CONTROL Pan-ck Pan-ck Pan-ck Pan-ck Treatment stop Treatment start Treatment start DOX Pan-ck Pan-ck Pan-ck Pan-ck DOCETAXEL Pan-ck Pan-ck Pan-ck Pan-ck E D C DOX + DOCETAXEL 0.09% 1.12% 0.06% 1.61% 0.4% 42.8% 0.65% 44.65% Pan-ck Pan-ck Pan-ck Pan-ck 92% 6.83% 90.8% 7.5% 27.4% 29.4% 30.1% 24.6% Treatment Start F H Treatment start Treatment stop G Figure 2 (SUM159)
A B Treatment Start Treatment Start Figure S2 (MC1, UM2)
A B D SUM159-Neg-DsRed SUM159 Non-infection SUM159-mirZip93-DsRed C SUM159-mir93 control SUM159-mir93 DOX Figure S3 (SUM159)
A D B E C Treatment start Figure 3 (MCF7)
Non-CD24-CD44+ CD24-CD44+ ALDH- ALDH+ ALDH- ALDH+ Figure S4
TET-inducible mir93 lentivirus infected SUM159 (SUM159-mir93) A FACS ALDH- cells ALDH+ cells in suspension culture +/- Tetracycline (10 hrs) CTRL DOX CTRL DOX RNA isolation Affymetrix array CTRL DOX CTRL DOX RMA method 352 probesets downregulated with at least 2-fold changes 2110 probesets downregulated with at least 2-fold changes Compare to the predicted targets from TargetScan 12 Overlapped targets (0 stem cell genes) 127 Overlapped targets (>24 stem cell genes) B Figure 4 (SUM159)
B A CTRL 0.86% G0/G1: 64% S/G2/M: 34% DOX 47.31% 57.47% 48.58% 39.08% G0/G1: 42% S/G2/M: 53% SUM159-mir93 Figure 5
CTRL DOX G0/G1: 31% S/G2/M: 68% G0/G1: 47% S/G2/M: 48% HCC1954-mir93 G0/G1: 53% S/G2/M: 42% G0/G1: 47% S/G2/M: 49% MCF7-mir93 Figure S6
Ki67 MCM7 DAPI Merge TOTAL ALDH+ ALDH- Figure S7
stem cell Mir93 - Mcm7 - Proliferating early progenitors Myc Self-renewal Differentiated cells Mir93 + Mcm7 + Quiescent stem cell pool SUM159 Mir93 - Mcm7 - ALDH+ Mcm7 Mir93 Mcm7 HCC1954 mir93 E2F1 Differentiation Cell proliferation CSC MCF7 ALDH- Figure 6