Analysis of KIR Antibodies in Transfected HEK293 Cells Using Dot Plots
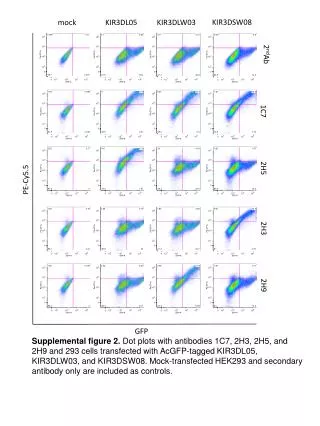
This supplemental figure presents dot plots illustrating the binding profiles of various antibodies (1C7, 2H3, 2H5, and 2H9) to 293 cells transfected with AcGFP-tagged KIR3DL05, KIR3DLW03, and KIR3DSW08. Additionally, controls include mock-transfected HEK293 cells and dots for secondary antibodies only. The data helps in understanding the antibody specificity and engagement with KIR receptor variants. The visualization through dot plots assists in discerning differences in expression levels among the transfected constructs.

Analysis of KIR Antibodies in Transfected HEK293 Cells Using Dot Plots
E N D
Presentation Transcript
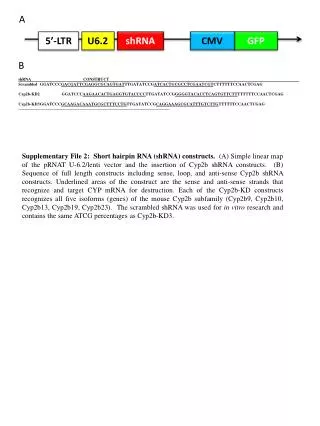
KIR3DSW08 KIR3DLW03 KIR3DL05 mock 2ndAb 1C7 2H5 PE-Cy5.5 2H3 2H9 GFP Supplementalfigure 2. Dotplotswithantibodies 1C7, 2H3, 2H5, and 2H9 and 293 cellstransfectedwithAcGFP-tagged KIR3DL05, KIR3DLW03, and KIR3DSW08. Mock-transfected HEK293 andsecondaryantibodyonlyareincludedascontrols.