GFP
A. MSCV. MSCV. GFP-RV. 5 ‘ LTR. IRES. GFP. 3 ‘ LTR. 3 ‘ LTR. mIFN- . IRES. GFP. IFN/GFP-RV. 5 ‘ LTR. B. GFP-RV IFN/GFP-RV. 35%. 34%. 55%. 56%. CD 8. 2%. 2%. 8%. 8%. GFP. C. GFP-RV IFN/GFP-RV. 99%. 99%.

GFP
E N D
Presentation Transcript
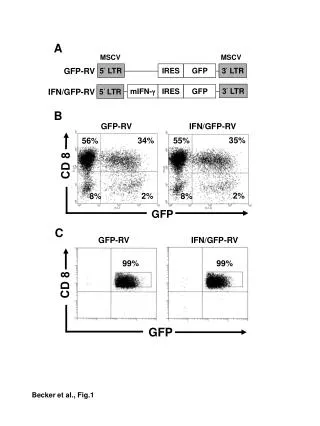
A MSCV MSCV GFP-RV 5‘ LTR IRES GFP 3‘ LTR 3‘ LTR mIFN- IRES GFP IFN/GFP-RV 5‘ LTR B GFP-RV IFN/GFP-RV 35% 34% 55% 56% CD 8 2% 2% 8% 8% GFP C GFP-RV IFN/GFP-RV 99% 99% CD 8 GFP Becker et al., Fig.1
100 80 60 40 20 Fibroblasts IFN--/- CD8+cells A B 300 Tc1 Tc2 250 200 pg IFN- / ml pg IFN- / ml 150 100 50 0 0 -CD3 -CD3 -CD3 stimulation: infection: GFP-RV IFN/GFP-RV GFP-RV IFN/GFP-RV IFN/GFP-RV C D IFN-+/+ CD8+cells IFN-+/+ CD8+cells 1200 1000 1000 800 800 600 pg IFN- / ml pg IFN- / ml 600 400 400 200 200 0 0 -peptide-peptide -CD3 -CD3 stimulation: infection: GFP-RV IFN/GFP-RV GFP-RV IFN/GFP-RV Becker et al., Fig.2
A Infection: IFN/GFP-RV Stimulation: unstimulated anti-CD3 Dilution: 1 1/3 1/9 1/27 -RT 1 1/3 1/9 1/27 -RT end. IFN viral IFN- total IFN GAPDH B Infection: GFP-RV Stimulation: unstimulated anti-CD3 Dilution: 1 1/3 1/9 1/27 -RT 1 1/3 1/9 1/27 -RT end. IFN viral IFN total IFN GAPDH C IFN/GFP-RV GFP-RV Unstimulated anti-CD3 IFN 67% 58% GFP Becker et al., Fig.3
2000 1800 1600 1400 pg IFN- / ml 1200 1000 800 600 400 200 0 GFP- GFP + GFP - GFP + 4000 Tc1 day 8 day16 3500 3000 2500 pg IL-4 / ml 2000 1500 1000 500 n.d. n.d. n.d. n.d. 0 GFP- GFP + GFP - GFP + day 8 day16 IFN- 2000 Tc1 Tc2 1800 1600 1400 pg IFN- / ml 1200 1000 800 600 400 200 0 GFP- GFP + GFP - GFP + day 8 day16 IL-4 4000 Tc2 3500 3000 2500 pg IL-4 / ml 2000 1500 1000 500 0 GFP- GFP + GFP - GFP + day 8 day16 Becker et al., Fig.4
A B C GFP-RV GFP-RV 80000 70000 60000 50000 pg IFN- / ml V8.1, 8.2 IFN- IFN/GFP-RV IFN/GFP-RV 40000 30000 20000 10000 0 GFP GFP GFP-RV IFN/GFP-RV Becker et al., Fig.5
Infection Stimulation pg IFN- / ml 1000 600 700 100 200 400 500 800 300 900 0 GFP-RV GFP + IL-12/IL-18 IL-12/IL-18 IFN/GFP-RV GFP - IFN/GFP-RV GFP + IL-12/IL-18 Becker et al., Fig.6
IFN/GFP-RV + HA peptide GFP-RV + HA peptide IFN/GFP-RV GFP-RV 10 9 8 7 6 mm mean tumor diameter 5 4 3 2 1 0 0 5 10 15 20 25 30 Days after Challenge A 60 50 40 % specific lysis 30 20 10 0 0 10:1 1:1 5:1 E:T ratio B Becker et al., Fig.7