Download
1 / 23
230 likes | 381 Vues
REVIEW OF EEA WORK; AGRICULTURE; WATER QUALITY AND WATER QUANTITY. Rob Collins Project Manager – Water and Agriculture Group. Objectives. Assess the impact of agriculture upon water quality and quantity, Europe wide

E N D
REVIEW OF EEA WORK; AGRICULTURE; WATER QUALITY AND WATER QUANTITY Rob Collins Project Manager – Water and Agriculture Group
Objectives • Assess the impact of agriculture upon water quality and quantity, Europe wide • Fulfil SOE reporting requirements. Recent streamlining with legislative reporting • Information dissemination; e.g. reports, WISE – Water Information System for Europe - website • Predict future impacts by exploring changes in driving forces, e.g. policy and legislation, climate change, etc. 2010 SOE Outlook.
Impacts upon Water Quality • Adopt a DPSIR approach with a focus upon nutrients (N and P) and pesticides • Two key ‘pressure’ indicators; gross nutrient balances and diffuse emissions • Nutrient and pesticide concentrations in water bodies indicate the ‘state’ or ‘impact’.
Gross Nutrient Balances • The Gross nitrogen balance estimates the potential surplus of nitrogen on agricultural land (kg/ha) • Simple approach, easy to interpret, policy relevant, fed by Europe-wide datasets, potential indicator of nutrient water quality • Inputs; Fertilisers (inorganic & organic; Fixation; atmospheric deposition • Outputs; harvested crops;
Gross Nutrient Balances • EEA support to the OECD/Eurostat methodology and also research models • Joint Eurostat/EEA/OECD/JRC workshop in September • Development towards regional calculations • Improvement and harmonisation of methods. Establishment of a ‘library’ of coefficients.
EEA-specific objectives; Scale • Balances calculated at a River Basin District Scale, would align with the Management Plans of the WFD. • Much data input to balances is held at an administrative scale; re-aggregation is required. • RBD level balances have been developed, Europe-wide.
EEA-specific objectives; Link to Water Quality • The basic balance method provides only a surrogate for nutrient water quality. • Better linkage would make the balance more powerful with respect to SOER and supporting policy, particularly if the fate of a surplus can be predicted i.e. loss to water or air, or retained in soil pools
EEA-specific objectives; Link to Water Quality • Some balance models already provide the air/water prediction e.g. MITERRA-Europe. • In addition, ETC-Water are exploring the issue of linkage; reviewing Europe-wide information on denitrification, volatilisation, retention in soil pools and time lags in groundwater.
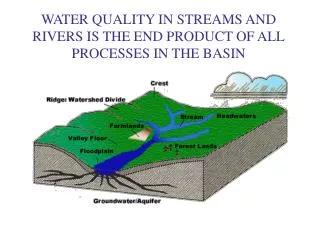
Diffuse Emissions from Agriculture • Emissions or loads at the catchment outlet in units of kg/ha/yr • Information required under SOE and legislative (e.g. E-PRTR, WFD) reporting. • Streamlined reporting template established, trial data will be transferred in 2008 • Data required for a range of pollutants, by source, at the River Basin District scale. Will go onto WISE website
Nutrient Source Apportionment – previous EEA review of information
Diffuse Nutrient Emissions • New data submitted may be calculated via more than one method, e.g. using river load data, export coefficients, detailed models. • Necessary to ensure ‘like with like’ comparisons can be made • Emissions workshop in September to discuss these issues
Nutrients and Pesticides in Water • A ‘State’ or ‘Impact’ indicator. • Information provided through the EIONET-Water monitoring network; • Designed to give a representative assessment of the quality of water bodies across Europe. • As with the emissions data, there is an aim to streamline this SOER with that required under legislation, e.g. WFD, Nitrates Directive etc.
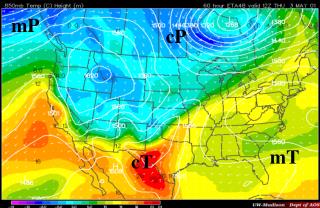
Nitrates in Rivers • Concentrations reflect the net effect of a number of sources and policies • E.g. for N; agricultural diffuse sources (WFD, Nitrates Directive, CAP) and point sources such as wastewater discharges (UWWTD) • It is possible to isolate a single source by selecting specific catchments
Pesticides in Groundwater●Decline in banned pesticides e.g. Atrazine
Pesticides in Groundwater Percentage of monitored groundwater bodies with pesticide concentrations exceeding 0.1 µg/l in 1999, 2002 and 2005
Pesticides in Groundwater • Large spatial and temporal variation in data collected. Generally a lack of data. • Large increase in data provided in recent years is good, but makes trend analysis difficult. • Very large range in pesticides, new ones emerge, others are banned • Greater focus with Priority Substances under the WFD, emissions/loads to be calculated.
Agricultural Water Use • Relates primarily to irrigation, some other uses, however, e.g. washing down of dairy sheds • Currently, no pan-European dataset available that quantifies actual water use (m3/year) other than at a national scale (OECD/Eurostat questionnaire) • Annual data only, nothing seasonal
Agricultural Water Use • Need to use ‘surrogate’ or indirect measures of water use • WISE-SOE (streamlined) will receive water use information by sector and by RBD (also a WFD requirement) some challenges in getting sub-yearly information – begins 2008 • Publication of a Water resources report this year – agriculture as a key sector
Regional Water Usage; national values weighted by area equipped for irrigation • Derived from FSS • An IRENA indicator • A rough estimate, ‘equipped area’ doesn’t describe actual water use
SOER Outlook 2010 • External Contractors to undertake scenarios including those related to water use by all sectors, including agriculture • Examine the impact of key drivers • Possible that the work will also include agricultural-water quality scenarios (e.g. impact of the Nitrates Directive upon N surplus)