Introduction to Satellite Remote Sensing (continued)
410 likes | 558 Vues
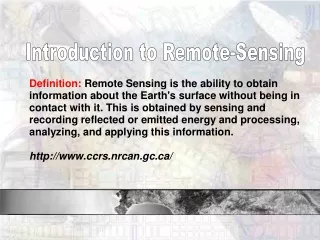
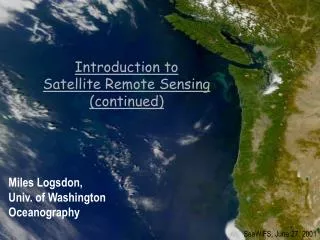
Introduction to Satellite Remote Sensing (continued). Miles Logsdon, Univ. of Washington Oceanography. SeaWiFS, June 27, 2001. We “approach” RS in two ways. To classify or group thematic land surface materials To detect a biophysical process. Cluster and Classify. Spectral Profile.

Introduction to Satellite Remote Sensing (continued)
E N D
Presentation Transcript
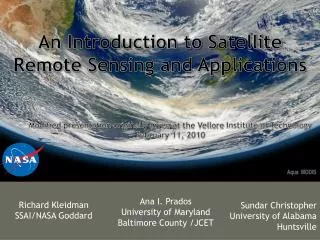
Introduction to Satellite Remote Sensing(continued) Miles Logsdon, Univ. of Washington Oceanography SeaWiFS, June 27, 2001
We “approach” RS in two ways • To classify or group thematic land surface materials • To detect a biophysical process
Dimensionality N = the number of bands = dimensions …. an (n) dimensional data (feature) space Measurement Vector Mean Vector Feature Space - 2dimensions 190 85 Band B Band A
Spectral Distance * a number that allows two measurement vectors to be compared
Classification Approaches • Unsupervised: self organizing in multi-dimensions • Easy, quick, something you should be able to do • Supervised: training with spectral signatures • More thought, planning ahead, for target application • Hybrid: self organization by categories • Just what it implies • Spectral Mixture Analysis: sub-pixel variations • Seeks the composition of the pixel signatures
Clustering / Classification • Clustering or Training Stage: • Through actions of either the analyst’s supervision or an unsupervised algorithm, a numeric description of the spectral attribute of each “class” is determined (a multi-spectral cluster mean signature). • Classification Stage: • By comparing the spectral signature to of a pixel (the measure signature) to the each cluster signature a pixel is assigned to a category or class.
terms • Parametric = based upon statistical parameters (mean & standard deviation) • Non-Parametric = based upon objects (polygons) in feature space • Decision Rules = rules for sorting pixels into classes
Unsupervised ClusteringMinimum Spectral Distance ISODATA I - iterative S - self O - organizing D - data A - analysis T - technique A - (application)? Band B Band A Band B Band A 1st iteration cluster mean 2nd iteration cluster mean
Cluster center (mean) Possible pixel assignments Band 4 Band 3 Part of the classification process: ISODATA clustering algorithm Each data pixel is assigned to a cluster based on the distance of a pixel from the center of a cluster (“Euclidean distance”)
Supervised ClassificationAssigning spectral signatures to clusters by selecting pixel in “geographic space”
Supervised ClassificationAssigning spectral signatures to clusters by selecting pixel in “Feature space”
Classification Decision Rules • If the non-parametric test results in one unique class, the pixel will be assigned to that class. • if the non-parametric test results in zero classes (outside the decision boundaries) the the “unclassified rule applies … either left unclassified or classified by the parametric rule • if the pixel falls into more than one class the overlap rule applies … left unclassified, use the parametric rule, or processing order • Non-Parametric • parallelepiped • feature space • Unclassified Options • parametric rule • unclassified • Overlap Options • parametric rule • by order • unclassified • Parametric • minimum distance • Mahalanobis distance • maximum likelihood
cluster mean Candidate pixel Parallelepiped • Maximum likelihood • (bayesian) • probability • Bayesian, a prior (weights) Band B Band A Minimum Distance Band B Band A
Class Namesor“Classification Systems” USGS - U.S. Geological Survey Land Cover Classification Scheme for Remote Sensor Data USFW - U.S. Fish & Wildlife Wetland Classification System NOAA CCAP - C-CAP Landcover Classification System, and Definitions NOAA CCAP - C-CAP Wetland Classification Scheme Definitions PRISM- PRISM General Landcover King Co. - King County General Landcover (specific use, by Chris Pyle) • Level • 1 Urban or Built-Up Land • 11 Residential • 12 Commercial and Services • 13 Industrial • 14 Transportation, Communications and Utilities • 15 Industrial and Commercial Complexes • 16 Mixed Urban or Built-Up • 17 Other Urban or Built-up Land • 2 Agricultural Land • 21 Cropland and Pasture • 22 Orchards, Groves, Vineyards, Nurseries and Ornamental Horticultural Areas • 23 Confined Feeding Operations • 24 Other Agricultural Land
Resolution and Spectral Mixing Thanks to: Robin Weeks
Detecting a Process: Two examples Using “band math”
Laboratory Spectral Signatures IICommon Urban Materials Healthy grass Concrete Astroturf wavelength Thanks to Robin Weeks
Vegetation:Pigment in Plant Leaves (Chlorophyll) strongly absorbs visible light (0.4 to 0.7 μm)Cell Structure however strongly reflects Near-IR (0.7 – 1.1 μm) Thanks to Robin Weeks
NDVI When using LANDSAT: Simple Ratio Band 3 Band 4 NDVI Band 4 - Band 3 Band 4 + Band 3 (courtesy http://earthobservatory.nasa.gov)
Ocean Color • Let’s begin with phytoplankton • Phyton = plant; planktos = wandering. • These reproduce asexually, are globally distributed, consist of 10s of thousands of species and make up about 25% of the total planetary veg. • These are the grass that the zooplankton graze upon. • And, they fix carbon as well.
Chloroplasts contain pigments Chaetoceros species of diatoms: cells are 20-25 mm in diameter.
Water provides an internal standard shape for spectral comparison with other variable components • Slopes for pigments and CDOM similar from 440 to 600 nm, but are opposite from 400 to 440 nm • Note that detritus is include with CDOM since shapes are similar • Spectral de-convolution of pigment absorption from CDOM absorption is straight-forward • Shapes of phytoplankton or pigment absorption are not constant (next slide) • For Case 2 waters, ratio of CDOM to chlorophyll a is not constant Strategy for Spectral Separation of Absorption Components with Semi-Analytic Algorithm Ken Carder: University of South Florida
Colored Dissolved Organic Material (CDOM) • Organic Sources • Terrestrial CDOM • decay vegetation from river and nearshore • Ocean CDOM • detritus - cell fragments, zooplankton fecal • Inorganic Sources • Sand & Dust => Errosion • rivers, wind, wave or current suspension
What’s the difference between MODIS chlorophylls? • “Case 1” waters: Chlor_MODIS (Clark) This is an empirical algorithm based on a statistical regression between chlorophyll and radiance ratios. • “Case 2” waters: Chlor_a_3 (Carder) This is a semi-analytic (model-based) inversion algorithm. This approach is required in optically complex “case 2” (coastal) waters and low-light, nutrient-rich regions (hi-lats). • A 3rd algorithm was added to provide a more direct linkage to the SeaWiFS chlorophyll: • “SeaWiFS-analog” Chlor_a_2 (Campbell) • SeaWiFS algorithm OC4.v4 (O’Reilly) Ken Carder: University of South Florida
R(l) Florescence Independent of Chl-a Chl-a increasing
Case 1 Rrs Model with superimposed MODIS bands 8-14: All variables co-vary with chlorophyll a Note that slopes between blue and green wave lengths decrease with increasing chlorophyll, explaining the strategy of empirical algorithms Case 2 waters are more complicated Ken Carder: University of South Florida
SeaWiFS empirical OC4 algorithm for Chl-a; Called a maximum-band ratio alg.