Download
1 / 19
190 likes | 296 Vues
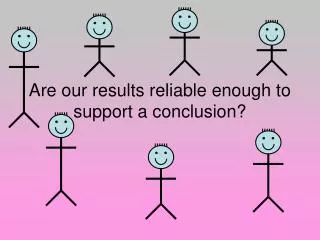
Are our results reliable enough to support a conclusion?. D8. C1. Imagine we chose two children at random from two class rooms…. … and compare their height …. D8. C1. … we find that one pupil is taller than the other. WHY?. D8. C1.

E N D
D8 C1 Imagine we chose two children at random from two class rooms… … and compare their height …
D8 C1 … we find that one pupil is taller than the other WHY?
D8 C1 There is a significant difference between the two groups, so pupils in C1 are taller than pupils in D8 REASON 1: YEAR 7 YEAR 11
D8 C1 TITCH HAGRID (Year 9) (Year 9) By chance, we picked a short pupil from D8 and a tall one from C1 REASON 2:
How do we decide which reason is most likely? MEASURE MORE STUDENTS!!!
D8 C1 If there is a significant difference between the two groups… … the average or mean height of the two groups should be very… … DIFFERENT
D8 C1 If there is no significant difference between the two groups… … the average or mean height of the two groups should be very… … SIMILAR
Living things normally show a lot of variation, so… Remember:
C1 Sample D8 Sample Average height = 168 cm Average height = 162 cm It is VERY unlikely that the mean height of our two samples will be exactly the same Is the difference in average height of the samples large enough to be significant?
16 16 C1 Sample 14 14 12 12 10 10 Frequency Frequency 8 8 6 6 4 4 2 2 180-189 160-169 140-149 140-149 160-169 170-179 150-159 170-179 150-159 Height (cm) D8 Sample 180-189 Height (cm) We can analyse the spread of the heights of the students in the samples by drawing histograms Here, the ranges of the two samples have a small overlap, so… … the difference between the means of the two samples IS probably significant.
16 16 C1 Sample 14 14 12 12 10 10 Frequency Frequency 8 8 6 6 4 4 2 2 180-189 160-169 140-149 140-149 160-169 170-179 150-159 170-179 150-159 Height (cm) D8 Sample 180-189 Height (cm) Here, the ranges of the two samples have a large overlap, so… … the difference between the two samples may NOT be significant. The difference in means is possibly due to random sampling error
You can calculate standard deviation using the formula: (Σx)2 Where: Sx is the standard deviation of sample Σ stands for ‘sum of’ x stands for the individual measurements in the sample n is the number of individuals in the sample Σx2 - Sx = n n - 1 To decide if there is a significant difference between two samples we must compare the mean height for each sample… … and the spread of heights in each sample. Statisticians calculate the standard deviation of a sample as a measure of the spread of a sample
( x1– x2 ) Where: x1 is the mean of sample 1 s1 is the standard deviation of sample 1 n1 is the number of individuals in sample 1 x2 is the mean of sample 2 s2 is the standard deviation of sample 2 n2 is the number of individuals in sample 2 t = (s1)2 (s2)2 + n1 n2 Student’s t-test The Student’s t-test compares the averages and standard deviations of two samples to see if there is a significant difference between them. We start by calculating a number, t t can be calculated using the equation:
C1: x1 = D8: x2 = x2 – x1 = 168.27 – 161.60 = Worked Example: Random samples were taken of pupils in C1 and D8 Their recorded heights are shown below… Step 1: Work out the mean height for each sample 161.60 168.27 Step 2: Work out the difference in means 6.67
D8: C1: (s2)2 (s1)2 = = n2 n1 Step 3: Work out the standard deviation for each sample C1: s1 = 10.86 D8: s2 = 11.74 Step 4: Calculate s2/n for each sample 10.862÷ 15 = 7.86 11.742÷ 15 = 9.19
Step 5: Calculate (s2)2 (s2)2 (s1)2 (s1)2 (s1)2 = = (7.86 + 9.19) = + + + n2 n2 n1 n1 n1 (s2)2 n2 t = 6.67 = 4.13 x2 – x1 4.13 Step 6: Calculate t (Step 2 divided by Step 5) 1.62
Step 7: Work out the number of degrees of freedom d.f. = n1 + n2 – 2 = 15 + 15 – 2 = 28 Step 8: Find the critical value of t for the relevant number of degrees of freedom Use the 95% (p=0.05) confidence limit Critical value = 2.048 Our calculated value of t is below the critical value for 28d.f., therefore, there is no significant difference between the height of students in samples from C1 and D8
Samples • Independent sample • Correlated sample