Download
1 / 12
130 likes | 266 Vues
Empirical Ionospheric Model Based on Saint Santin Incoherent Scatter Radar Data. Angela Zalucha MIT Haystack Observatory/ University of Illinois at Urbana Champaign zalucha@uiuc.edu. Background Information.

E N D
Empirical Ionospheric Model Based on Saint Santin Incoherent Scatter Radar Data Angela Zalucha MIT Haystack Observatory/ University of Illinois at Urbana Champaign zalucha@uiuc.edu
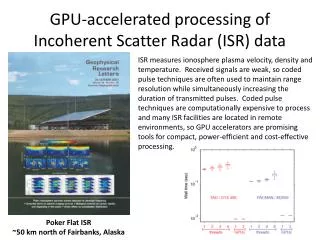
Background Information • Ionospheric data recorded by the bistatic incoherent scatter radar at St. Santin, France (45-47 N c.f. 54 N for Millstone) • Data obtained from the CEDAR/MADRIGAL database • Data spans the years 1966 through 1987 • Model used originally developed for Millstone Hill data
Building a Model We measured… With the corresponding… Alt. F107 Ne LT Day No. Te Ti IN IN Measurements are binned according to Alt., LT, Day No. Empirical Model OUT F107 dependence determined through linear least squares fit
Investigating the Data Distribution Number of points per month Number of points per altitude and LT Number of points per F107 Check if linear fit is good for F107 F107
Data and Model Profiles log(Ne) • Check how well measured data and model data match • Here we plot each parameter vs. LT for Day No. = 184 and Alt. = 275 Ti Measured Data Te F107 = 60 F107 = 100 LT (hours) F107 = 135 F107 = 200
Data and Model Profiles log(Ne) Ti Te • Here we plot Alt. vs. each parameter for LT = 12 and Day No. = 184 • The limits of the F107 range should be at the edges of the data respectively Alt. (km) Measured Data F107 = 60 F107 = 100 F107 = 135 F107 = 200
Millstone Hill Vs. St. Santin LT = 12 hours Alt. = 250 km F107 = 135 • Each model created using essentially the same software—do they produce similar outputs? • Models match reasonably well • St. Santin tends to vary less than Millstone and produce quantitatively higher Ne outputs log(Ne) Ti log(Ne) Te Ti LT (hours) Te Day No. = 184 Alt. = 275 km F107 = 135 Day No.
Movies allow us to view multiple parameters at once log(Ne): Alt. vs. LT, progressing over Day No., F107 = 135
Movies allow us to view multiple parameters at once Ti: Alt. vs. LT, progressing over Day No., F107 = 135
Movies allow us to view multiple parameters at once Te: Alt. vs. LT, progressing over Day No., F107 = 135
The Virtual St. Santin Radar • Calculates predicted ionospheric conditions at the current time • Updated every 15 minutes • http://www.haystack.mit.edu/madrigal/vssr
Conclusion The Saint Santin Empirical Model produces reasonable results with respect to both the measured data and the Millstone Hill Empirical Model. Angela Zalucha zalucha@uiuc.edu University of Illinois/ MIT Haystack Observatory Advisors John Holt Shunrong Zhang jmh@haystack.mit.edu shunrong@haystack.mit.edu MIT Haystack Observatory