Earned Value Analysis
Learn about Earned Value Analysis to measure project performance, budget, and schedule adherence. Includes key questions, example, indices, forecasting, and cost estimation.


Earned Value Analysis
E N D
Presentation Transcript
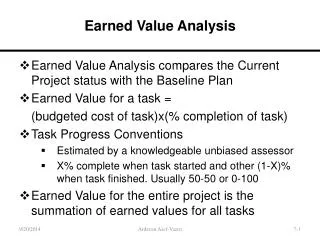
Scope, time and cost Key Questions Is the project performing to budget? Is the project on schedule to deliver the agreed scope? How is project health measured?
Budget Plan Vs. Actual Costs Time Now Total Budget Budget € Actual Costs Time
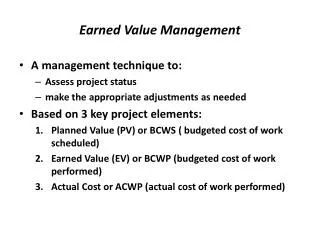
Earned Value Characteristics • Point in Time Evaluation • How much work did you PLAN to complete? (Planned Value) • How much work did you ACTUALLY complete? (Earned Value) • How much did you spend to complete the work? (Actual Cost)
EVA Example • Project • € 10,000 • 4 weeks. • Week 3: • 50% complete • actual costs to date $9,000
Progress • Planned Value (PV) = $7,500 • Actual Cost (AC) = $9,000 • Earned Value (EV) = $5,000
Earned Value? • Accomplishment is (planned) work that has been carried out successfully. • The budgeted cost of that work quantifies the accomplishment. • This is called ‘earned value’ actual € budget Earned Value (EV) time
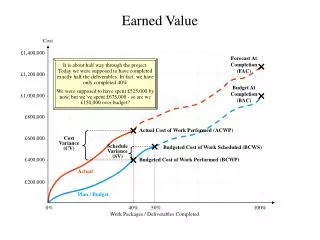
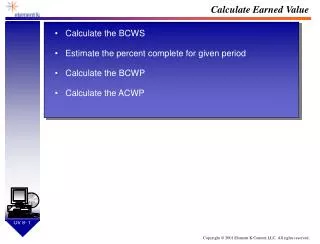
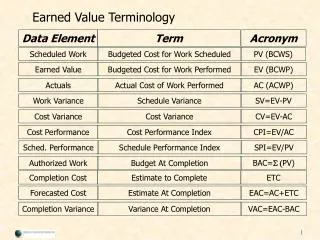
How much work should be done? How much work is done? How much did it cost? Budget Budgeted Cost for Work Scheduled (BCWS) Earned Value (EV) Budgeted Cost for Work Performed (BCWP) Actuals Actual Cost of Work Performed (ACWP) Basic definitions
Variance • CV (Cost Variance) • BCWP - ACWP • earned value - actual cost • SV (Schedule Variance) • BCWP - BCWS • earned value - planned value schedule actual € CV SV earned time
1.1 1.0 0.9 0.8 CPI 1.1 1.0 0.9 0.8 SPI Performance Indices • CPI(Cost Performance Index) • BCWP/ACWP • earned/actual • SPI(Schedule Performance Index) • BCWP/BCWS • earned/planned
What is the project health? • Schedule Variance • = EV – PV = $5,000 – $7,500 = - $2,500 • Schedule Performance Index (SPI) • = EV/PV = $5,000 / $7,500 = .66 • Cost Variance • = EV – AC = $5,000 - $9,000 = - $4,000 • Cost Performance Index (CPI) • = EV/AC = $5,000 / $9,000 = .55
Conclusion • Objective metrics indicate the project is behind schedule and over budget. • On-target projects have an SPI and CPI of 1 or greater
Survey says….. • over 800 DoD programs show that ..... • no program has ever improved their performance better than the performance at the 15% complete point • Once a project is 10% complete, the overrun at completion will not be less than the current overrun. • Once a project is 20% complete, the CPI does not vary from its current value by more than 10%.
ACWP Estimate To Complete Actual Costs ETC Estimates at Completion (EAC) Now EAC € Time
Independent Forecasts of EAC • EAC: a statistical forecast of final project costs • Basic Formula: • Forecast 1(Best Case): “Cumulative CPI X SPI”EAC Remaining Work (BAC - EV) Actual Costs + = EAC Performance Factor Remaining Work (BAC - EV) Actual Costs + = EAC Cumulative (CPI X SPI)
Independent Forecasts of EAC 2 • Forecast 2 (Most Likely): “Current CPI” EAC • Forecast 3 (Worst Case): “Current CPI X SPI” EAC Remaining Work (BAC - EV) Actual Costs + = EAC Current CPI Remaining Work (BAC - EV) Actual Costs + = EAC Current (CPI x SPI)
Forecasting Costs • Estimate At Complete = Budget At Complete (BAC) / CPI = $10,000 / .55 = $18,181 At the end of the project, the total project costs will be $18,181
Establish Ranges to Guide Traffic Light Status • Traffic Light status is useful in conveying overall project with one color • Establish objective SPI and CPI ranges to determine the true project color. Green [1.0 - .95] Yellow [.94-.85] Red [.84, 0]