Histograms
Histograms. What are they? How do I use them? Rex Waygood Fordingbridge Camera Club 2005. Histogram = Graph. A histogram is just a graph where the number of items that have a characteristic are plotted against that characteristic.


Histograms
E N D
Presentation Transcript
Histograms What are they? How do I use them? Rex Waygood Fordingbridge Camera Club 2005
Histogram = Graph • A histogram is just a graph where the number of items that have a characteristic are plotted against that characteristic. • For example let us obtain a histogram for an arrangement of tiles in a matrix • The height of the ‘piles’ in the histogram are a count of the number of times that ‘thing’ occurs
How does that relate to our Histogram? • In the camera sensor the amount of light falling is measured in as a proportion of 255. Each pixel produces an output scaled 0-255 • Black = 0 • White = 255 • The number of pixels at each level of brightness is therefore displayed on the vertical axis. In this image we have 1/3rd Black, 1/3rd Mid Grey, 1/3rd White. 0 127 255
Add some other Pixels • 25% & 75% Grey at 1/3rd of the remaining area of the original blocks. • Note It looks like a 1/4th but don’t forget the new blocks occupy space from the old blocks
A Graded Fill? • The graded fill should give us a horizontal line. Due to the mathematical way the graded fill was generated I actually got:-
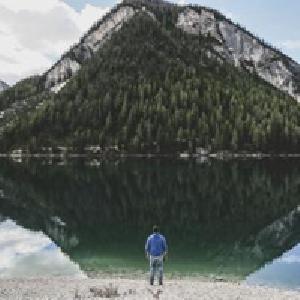
So what does this mean for a picture? • Let us chose a picture where we might guess the histogram. • How about my Kerrera? • It should have a mass of Mid grey Pixels and not much else Is this what you expected?
OK. Now Chimp! • Chimping is the name given to taking a picture and then looking at the Histogram! • So you’ve just taken a picture and you get the following Histogram. • Is it under or over exposed? So this histogram shows that the image is under exposed. Did you get it right?
Another Example • You take a picture and Chimp and get the following Histogram Under or Over Exposed? The image is over exposed and has many ‘white’ pixels. Note, some cameras have a facility that flashes the peak white pixels so you can see where they are.
So if I always check the histogram is everything always perfect?
What do you see? • The Histogram show the image to be well exposed. • There are no peak white pixels • Everything in the ‘garden’ should be good. • However I noticed a lack of detail in the bright reds. • So is this perfectly exposed?
So what is going on? • Look at the Histogram in this software. • It shows the ‘white’ pixel histogram as per the previous software but now shows the brightness level for the RGB channels. • This shows that the red pixels are saturated at 255 and this is why there is a loss of detail in the ‘bright’ reds. • How is this avoided? • Use the old technique of bracketing your exposure where you have doubts. • OR • Buy an expensive camera which displays the RGB Histogram!
Conclusions • The Histogram is a very useful tool to get the ‘right’ exposure. • Look at the Histogram when you take a picture. • Adjust the EV Offset of your camera to move the Histogram in the correct direction. • Do not forget the Histogram can fool you when you have bright prime colours. • Most important, enjoy your photography.