Intro to Sinusoids
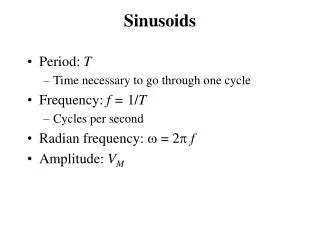
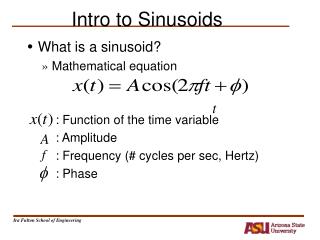
Intro to Sinusoids. What is a sinusoid? Mathematical equation : Function of the time variable : Amplitude : Frequency (# cycles per sec, Hertz) : Phase. FREQUENCY Radians/sec Hertz (cycles/sec) PERIOD (in sec). AMPLITUDE Magnitude PHASE. SINUSOIDAL SIGNAL.

Intro to Sinusoids
E N D
Presentation Transcript
Intro to Sinusoids • What is a sinusoid? • Mathematical equation : Function of the time variable : Amplitude : Frequency (# cycles per sec, Hertz) : Phase
FREQUENCY Radians/sec Hertz (cycles/sec) PERIOD (in sec) AMPLITUDE Magnitude PHASE SINUSOIDAL SIGNAL Courtesy of James McClellan et al, Signal Processing First, 2003
Intro to Sinusoids • What is a sinusoid? • Plot
Intro to Sinusoids • Examples
Intro to Sinusoids • Examples
Intro to Sinusoids • Examples
Intro to Sinusoids • How to plot a sinusoid? • Determine height • Determine zero crossings • Max height is +A • peaks oscillate: +A and -A • peaks occur when argument of cosine is a multiple of , i.e.,
Intro to Sinusoids • Zero crossings • where plot crosses zero • located at odd multiples of , i.e., • Note: cycles repeat (periodic function) • sufficient to determine peak and zero crossings in one cycle and then replicate cycle • Period = length of cycle =
Intro to Sinusoids • We can also get equation from plot • find the parameters , , and
Intro to Sinusoids • We can also get equation from plot • find the parameters , , and Answer:
Intro to Sinusoids • Procedure to get equation from plot • Find the amplitude • Find the period by measuring the time distance between positive peaks: • Find the phase by measuring the “time shift” (delay from 0) of a peak. Note: positive if peak moved to right, and negative if peak moved to left. • Then, compute
Intro to Sinusoids • Sinusoids can be interpreted as a “rotating phasor” • rotating angle • : speed of rotation (# cycles per sec) • : initial angle start point
Generating Signals using Sinusoids • Main reason why sinusoids are important: they are basic tools for constructing other useful and more complicated signals • A new signal can be generated by combining together different sinusoids
Generating Signals using Sinusoids • Example: Beat Note Waveform • Beat notes generated by adding two sinusoids with nearby frequencies • They can also be generated by playing two neighboring piano keys • Mathematically: where small.
Generating Signals using Sinusoids • Example: Beat Note Waveform • Let • Matlab Script File: beatnote.m dur = 2.0; fs = 8000; f1 = 220; f2 = 180; t = 0: (1/fs): dur; x = cos(2*pi*f1*t)+cos(2*pi*f2*t); plot(t,x); xlabel(‘Time,t’); ylabel(‘Beat Signal’); sound(x,fs);
Generating Signals using Sinusoids • Example: Beat Note Waveform • Let • Matlab Function: beat.m function [x,t] = beat(f0, d, dur); fs = 8000; f1 = f0+d; f2 = f0-d; t = 0: (1/fs): dur; x = cos(2*pi*f1*t)+cos(2*pi*f2*t);
Matlab Functions • Example: Beat Note Waveform • Let • Matlab Script File using Function beat.m [x,t] = beat(200,20,1); plot(t,x); xlabel(‘Time,t’); ylabel(‘Beat Signal’); sound(x,fs);
Generating Signals using Sinusoids • A new signal can be generated by combining together different sinusoids • Periodic signals obtained when frequencies are integer multiples of : where is called harmonic frequency of and is called the fundamental frequency.
Generating Signals using Sinusoids • A new periodic signal can be generated by combining together sinusoids having harmonically related frequencies • Period = length of one cycle =
PERIODIC SIGNALS • Repeat every T secs • Definition • Example: • Speech can be “quasi-periodic” Courtesy of James McClellan et al, Signal Processing First, 2003
Generating Signals using Sinusoids • Example: Square Wave • For N =1:
Generating Signals using Sinusoids Square Wave generates using only first 3 harmonic Frequencies: T=0.1 Courtesy of James McClellan et al, Signal Processing First, 2003
Generating Signals using Sinusoids • Example: Square Wave • Matlab Function square.m function [x,t] = square(f0, N, dur); fs = 8000; t = 0:1/fs:dur; x = zeros(1,length(t)); for m = 0:N x = x + (8/((2*m+1)*pi))*cos(2*pi*(2*m+1)*f0*t- pi/2); end • Generate and plot square waves with = 25Hz, dur = 0.12 sec, and N=1,2,3,25
Generating Signals using Sinusoids • Example: Synthetic Vowel • Generated signal approximates the waveform produced by a man speaking the sound “ah”.
Vowel Waveform (sum of all 5 components) Courtesy of James McClellan et al, Signal Processing First, 2003
Generating Signals using Sinusoids • Example: Synthetic Vowel • Matlab Script File dur = 1; f = 100; fs = 8000; t = 0:1/fs:dur; x = 12226 * cos(2*pi*2*f*t + 1.508); x = x + 29416 * cos(2*pi*4*f*t + 1.876); x = x + 48836 * cos(2*pi*5*f*t - 0.185); x = x + 13621 * cos(2*pi*16*f*t - 1.449); x = x + 4723 * cos(2*pi*17*f*t); plot(t,x); xlabel(‘Time, t’); ylabel(‘Vowel’) sound(x,fs)
TUNING FORK EXAMPLE • “A” is at 440 Hertz (Hz) • Waveform is a SINUSOIDAL SIGNAL • Computer plot looks like a sine wave • This should be the mathematical formula: Courtesy of James McClellan et al, Signal Processing First, 2003
TUNING FORK A-440 Waveform Time (sec)
SPEECH EXAMPLE • More complicated signal (BAT.WAV) • Waveform x(t) is NOT a Sinusoid • Theory will tell us • x(t) is approximately a sum of sinusoids • FOURIER ANALYSIS • Break x(t) into its sinusoidal components • Called the FREQUENCY SPECTRUM Courtesy of James McClellan et al, Signal Processing First, 2003
Speech Signal: BAT • Nearly Periodic in Vowel Region • Period is (Approximately) T = 0.0065 sec Courtesy of James McClellan et al, Signal Processing First, 2003
DIGITIZE the WAVEFORM • x[n] is a SAMPLED SINUSOID • A list of numbers stored in memory • Sample at 11,025 samples per second • Called the SAMPLING RATE of the A/D • Time between samples is • 1/11025 = 90.7 microsec • Output via D/A hardware (at Fsamp) Courtesy of James McClellan et al, Signal Processing First, 2003
STORING DIGITAL SOUND • x[n] is a SAMPLED SINUSOID • A list of numbers stored in memory • CD rate is 44,100 samples per second • 16-bit samples • Stereo uses 2 channels • Number of bytes for 1 minute is • 2 X (16/8) X 60 X 44100 = 10.584 Mbytes Courtesy of James McClellan et al, Signal Processing First, 2003
SINES and COSINES • Always use the COSINE FORM • Sine is a special case: Courtesy of James McClellan et al, Signal Processing First, 2003
Sinusoidal Synthesis • Sinusoids with DIFFERENT Frequencies • SYNTHESIZE by Adding Sinusoids • SPECTRUM Representation • Graphical Form shows DIFFERENT Frequencies • SPECTROGRAM Tool • Shows how frequency content varies in function of time • MATLAB function is specgram.m Courtesy of James McClellan et al, Signal Processing First, 2003
SPECTROGRAM EXAMPLE • Two Constant Frequencies: Beats Courtesy of James McClellan et al, Signal Processing First, 2003
Time-Varying Frequency Diagram A-440 Frequency is the vertical axis Time is the horizontal axis Courtesy of James McClellan et al, Signal Processing First, 2003
Sinusoidal Synthesis: Motivation • Synthesize Complicated Signals • Musical Notes • Piano uses 3 strings for many notes • Chords: play several notes simultaneously • Human Speech • Vowels have dominant frequencies • Application: computer generated speech • Can all signals be generated this way? • Sum of sinusoids? Courtesy of James McClellan et al, Signal Processing First, 2003
Fur Elise WAVEFORM Beat Notes Courtesy of James McClellan et al, Signal Processing First, 2003
SIMPLE TEST SIGNAL • C-major SCALE: stepped frequencies • Frequency is constant for each note IDEAL Courtesy of James McClellan et al, Signal Processing First, 2003
SPECTROGRAM of C-Scale Sinusoids ONLY From SPECGRAM ANALYSIS PROGRAM ARTIFACTS at Transitions Courtesy of James McClellan et al, Signal Processing First, 2003
Spectrogram of LAB SONG Sinusoids ONLY Analysis Frame = 40ms ARTIFACTS at Transitions Courtesy of James McClellan et al, Signal Processing First, 2003
Time-Varying Frequency • Frequency can change vs. time • Continuously, not stepped • FREQUENCY MODULATION (FM) • CHIRP SIGNALS • Linear Frequency Modulation (LFM) VOICE Courtesy of James McClellan et al, Signal Processing First, 2003
New Signal: Linear FM QUADRATIC • Called Chirp Signals (LFM) • Quadratic phase • Freq will change LINEARLY versus time • Example of Frequency Modulation (FM) • Define “instantaneous frequency” Courtesy of James McClellan et al, Signal Processing First, 2003
INSTANTANEOUS FREQ Derivative of the “Angle” Makes sense • Definition • For Sinusoid: Courtesy of James McClellan et al, Signal Processing First, 2003
INSTANTANEOUS FREQ of the Chirp • Chirp Signals have Quadratic phase • Freq will change LINEARLY versus time Courtesy of James McClellan et al, Signal Processing First, 2003
CHIRP SPECTROGRAM Courtesy of James McClellan et al, Signal Processing First, 2003
CHIRP WAVEFORM Courtesy of James McClellan et al, Signal Processing First, 2003
OTHER CHIRPS • y(t) can be anything: • y(t) could be speech or music: • FM radio broadcast Courtesy of James McClellan et al, Signal Processing First, 2003
SINE-WAVE FREQUENCY MODULATION (FM) Courtesy of James McClellan et al, Signal Processing First, 2003
Music Synthesis • Musical notes synthesized using a sinewave at a given frequency. • Musical scale is divided into 8 octaves; each octave consists of 12 notes. • Notes in each octave are related to notes in previous and next octave: • The frequency of a note is twice the frequency of the corresponding note in the previous adjacent (lower) octave. • Each octave contains 12 notes (5 black keys and 7 white) and the ratio between the frequencies of the notes is constant between successive notes: fnext note = 21/12 fprevious note