Download
1 / 13
130 likes | 227 Vues
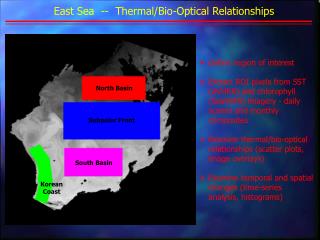
Investigate thermal/bio-optical connections in East Sea, analyze SST and chlorophyll imagery, observe spatial/temporal changes, focus on North Basin, Subpolar Front, South Basin, Korean Coast on May 21, 1999, with AVHRR and SeaWiFS data.

E N D
East Sea -- Thermal/Bio-Optical Relationships • Define region of interest • Extract ROI pixels from SST (AVHRR) and chlorophyll (SeaWiFS) imagery - daily scenes and monthly composites • Examine thermal/bio-optical relationships (scatter plots, image overlays) • Examine temporal and spatial changes (time-series analysis, histograms) North Basin Subpolar Front South Basin Korean Coast
North Basin -- May 21, 1999 AVHRR and SeaWiFS Collected ~ 6 hrs apart CHL CHL > 2.0 g/l Chlorophyll CHL > 2.0 g/l SST SST SST Chlorophyll SST SST
Subpolar Front -- May 21, 1999 AVHRR and SeaWiFS Collected ~ 6 hrs apart CHL CHL > 2.0 g/l Chlorophyll CHL > 2.0 g/l SST SST Chlorophyll SST SST
South Basin -- May 21, 1999 AVHRR and SeaWiFS Collected ~ 6 hrs apart CHL CHL > 2.0 g/l Chlorophyll SST SST CHL > 2.0 g/l Chlorophyll SST SST
Korean Coast -- May 21, 1999 CHL SST SST SST CHL > 2.0 g/l CHL > 2.0 g/l Chlorophyll SST SST SST
Subpolar Front -- April, May, June, 1999 SST April 21, 1999 CHL > 2.0 g/l CHL > 2.0 g/l Chlorophyll SST May 21, 1999 Chlorophyll SST June 9, 1999 Chlorophyll SST
Subpolar Front Chlorophyll SST 4/21/99 8.0 - 10.0 5/21/99 11.5 - 13.5 6/09/99 14.0 - 16.0
SeaWiFS Monthly Mean Chlorophyll Concentration, by Region January - August, 1999
Summary • SST at the front increased ~ 6° over 1.5 month period from late April to early June. • SST/chlorophyll relationship is complex: - high chlorophyll related to mixing regimes? - not tied as much to water mass distribution? • At Subpolar Front, chlorophyll concentration was highest south of front in March and April, north of front in May and June (although concentrations were lower). • Spatial/Temporal Distributions: April - highest chlorophyll in Korean Coastal and South Basin; lower at Front and North Basin. May - Decrease at Korean Coast and South Basin (sharp); no change at Front; highest at North Basin (sharp increase). June - All areas very low, particularly South Basin; North basin is the highest.