Download
1 / 6
100 likes | 235 Vues
This guide provides essential concepts for mastering graphing skills, focusing on two primary types of graphs: bar graphs and line graphs. Bar graphs are used to display data in distinct categories, featuring key elements like titles, labeled and scaled axes, and separated bars. Line graphs, on the other hand, illustrate how one variable responds to another, suitable for continuous data. Both types require proper axes and plotting techniques. Understanding these elements is crucial for effective data representation and analysis.

E N D
Hamburger Tacos Steak Pizza
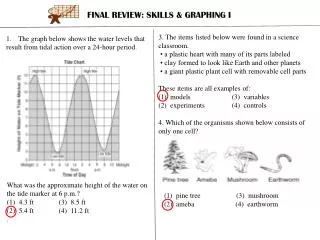
Bar Graph: • Used to display data in distinct categories • Must include: • -title • -draw axes • -labeled axes (include units) • -scaled y-axis • -bars with spaces in between
Line Graph: • Used to show how one variable changes in response to another variable • Used to show continuous data (other measurements in between) • Must include: • -title • -draw axes • -labeled axes (include units) • -scaled axes • -plot each point • -ruler to draw straight line