Download
1 / 1
10 likes | 146 Vues
Delayed onset of the South American Monsoon during the Last Glacial Maximum. Kerry H. Cook and Edward K. Vizy, Cornell University. I. INTRODUCTION

E N D
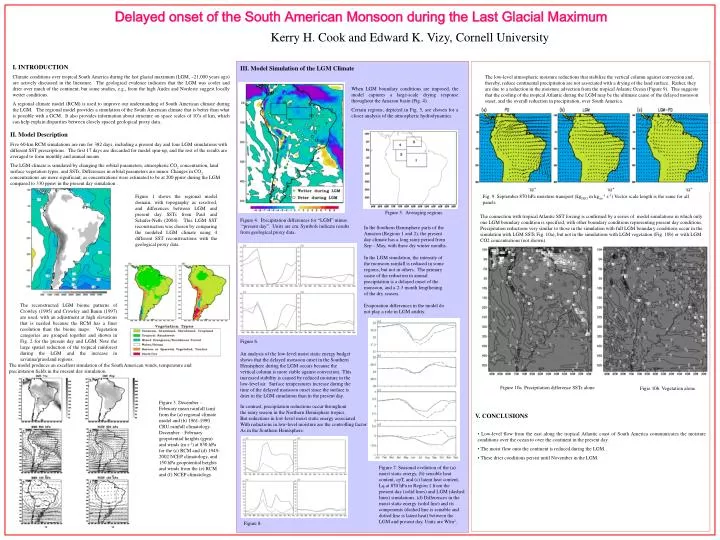
Delayed onset of the South American Monsoon during the Last Glacial Maximum Kerry H. Cook and Edward K. Vizy, Cornell University I. INTRODUCTION Climate conditions over tropical South America during the last glacial maximum (LGM, ~21,000 years ago) are actively discussed in the literature. The geological evidence indicates that the LGM was cooler and drier over much of the continent, but some studies, e.g., from the high Andes and Nordeste suggest locally wetter conditions. A regional climate model (RCM) is used to improve our understanding of South American climate during the LGM. The regional model provides a simulation of the South American climate that is better than what is possible with a GCM. It also provides information about structure on space scales of 10’s of km, which can help explain disparities between closely spaced geological proxy data. III. Model Simulation of the LGM Climate The low-level atmospheric moisture reductions that stabilize the vertical column against convection and, thereby, reduce continental precipitation are not associated with a drying of the land surface. Rather, they are due to a reduction in the moisture advection from the tropical Atlantic Ocean (Figure 9). This suggests that the cooling of the tropical Atlantic during the LGM may be the ultimate cause of the delayed monsoon onset, and the overall reduction in precipitation, over South America. When LGM boundary conditions are imposed, the model captures a large-scale drying response throughout the Amazon basin (Fig. 4). Certain regions, depicted in Fig. 5, are chosen for a closer analysis of the atmospheric hydrodynamics. II. Model Description Five 60-km RCM simulations are run for 382 days, including a present day and four LGM simulations with different SST prescriptions. The first 17 days are discarded for model spin-up, and the rest of the results are averaged to form monthly and annual means. The LGM climate is simulated by changing the orbital parameters, atmospheric CO2 concentration, land surface vegetation types, and SSTs.Differences in orbital parameters are minor. Changes in CO2 concentrations are more significant, as concentrations were estimated to be at 200 ppmv during the LGM compared to 330 ppmv in the present day simulation . Figure 1 shows the regional model domain, with topography as resolved, and differences between LGM and present day SSTs from Paul and Schäfer-Neth (2004). This LGM SST reconstruction was chosen by comparing the modeled LGM climate using 4 different SST reconstructions with the geological proxy data. Fig. 9. September 870 hPa moisture transport (kgH2O m kgair-1 s-1)Vector scale length is the same for all panels. Figure 5. Averaging regions. The connection with tropical Atlantic SST forcing is confirmed by a series of model simulations in which only one LGM boundary condition is specified, with other boundary conditions representing present day conditions. Precipitation reductions very similar to those in the simulation with full LGM boundary conditions occur in the simulation with LGM SSTs Fig. 10a), but not in the simulations with LGM vegetation (Fig. 10b) or with LGM CO2 concentrations (not shown). Figure 4. Precipitation differences for “LGM” minus “present day”. Units are cm. Symbols indicate results from geological proxy data. In the Southern Hemisphere parts of the Amazon (Regions 1 and 2), the present day climate has a long rainy period from Sep – May, with three dry winter months. In the LGM simulation, the intensity of the monsoon rainfall is reduced in some regions, but not in others. The primary cause of the reduction in annual precipitation is a delayed onset of the monsoon, and a 2-3 month lengthening of the dry season. Evaporation differences in the model do not play a role in LGM aridity. The reconstructed LGM biome patterns of Crowley (1995) and Crowley and Baum (1997) are used, with an adjustment at high elevations that is needed because the RCM has a finer resolution than the biome maps. Vegetation categories are grouped together and shown in Fig. 2 for the present day and LGM. Note the large spatial reduction of the tropical rainforest during the LGM and the increase in savanna/grassland regions. Figure 6. An analysis of the low-level moist static energy budget shows that the delayed monsoon onset in the Southern Hemisphere during the LGM occurs because the vertical column is more stable against convection. This increased stability is caused by reduced moisture in the low-level air. Surface temperatures increase during the time of the delayed monsoon onset since the surface is drier in the LGM simulation than in the present day. The model produces an excellent simulation of the South American winds, temperature and precipitation fields in the present day simulation. Figure 10a. Precipitation difference SSTs alone Figre 10b. Vegetation alone. Figure 3. December – February mean rainfall (cm) from the (a) regional climate model and (b) 1961-1990 CRU rainfall climatology. December – February geopotential heights (gpm) and winds (m s-1) at 850 hPa for the (c) RCM and (d) 1949-2002 NCEP climatology, and 150 hPa geopotential heights and winds from the (e) RCM and (f) NCEP climatology. In contrast, precipitation reductions occur throughout the rainy season in the Northern Hemisphere tropics. But reductions in low-level moist static energy associated With reductions in low-level moisture are the controlling factor As in the Southern Hemisphere. V. CONCLUSIONS • Low-level flow from the east along the tropical Atlantic coast of South America communicates the moisture conditions over the ocean to over the continent in the present day. • The moist flow onto the continent is reduced during the LGM. • These drier conditions persist until November in the LGM. • Figure 7. Seasonal evolution of the (a) moist static energy, (b) sensible heat content, cpT, and (c) latent heat content, Lq at 870 hPa in Region 1 from the present day (solid lines) and LGM (dashed lines) simulations. (d) Differences in the moist static energy (solid line) and its components (dashed line is sensible and dotted line is latent heat) between the LGM and present day. Units are W/m2. Figure 8.