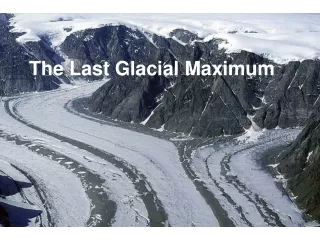
The Last Glacial Maximum
440 likes | 482 Vues
Explore the climate and environmental conditions of the Last Glacial Maximum, its impact on ice sheets, CO2 levels, vegetation, and more. Discover how the Earth's climate responded during this period.

The Last Glacial Maximum
E N D
Presentation Transcript
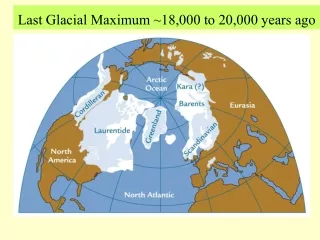
What was it like during the last glacial max? About 21K yrs ago ice sheets were at a max and CO2 was at a min. The ice volume was the product of successive 41K cycles that added ice volume until we maxed out. Oddly the insolation then was about what it is now…. Why the difference in climate? Ice Volume CO2
The effect of ice sheets The ice sheets are bigger….. The fundamental characteristic of ice…..it’s cold (duh…) Ice will cool the surround air and water Lots of ice will cool a lot…. Ice sheets are huge….2-4 km in height. They act as mountain ranges to deflect weather patterns They are bright….and will reflect much more sunlight back into space
So how are things different with ice sheets? • North Atlantic ocean temps are much colder • Air temps are also much colder • Since you get less evaporation from cold water into cold air, Northern Europe is dryer
The northern hemisphere climate was ice-driven • Large ice volumes hammered sea-surface temps • Water temps in the north atlantic (not exactly balmy now) were about 10C colder • Downstream the climate was much colder and drier. • Europe was mostly devoid of trees, mostly tundra grasses
There were some other interesting climate changes • We see climate shifts at the equator • Generally…high ice volumes result in more grassland • Probably drier….
Even farther south We see the same strong response to the ice volume signal in New Zealand Probably what is happening is we are seeing a global response to a global change…. CO2 is dropping as ice volume rises
It was dusty Loess is glacial-derived fine silt….glaciers grind rock into fine powder. This is what washes out from melting glaciers. And it is very windy around glaciers. Glacial age layers show about 10 times as much dust as now!
What was the vegetation like? Pollen is a great paleo-climate marker We know what conditions species like…. AND we can use 14C to date the pollen So we can track the changes in rainfall and temperature during the last ice age.
Even in the tropics there was some cooling due to reduced CO2 However, the cooling was probably not as much as suggested by the drop in treelines Effect of changes in moisture, sea level, and even the effect of lower CO2 on planet growth
Muir Glacier 1941 Muir Glacier 2004
Ice Cores • 18O record
Ice Core Layering 19 cm • This shows 11 annual layers • Summer layers are lighter, winter darker • Note the bubbles…..
These bubbles do trap the current atmosphere 36Cl from 1960s nuclear bombs in US glacier ice
Sealing takes time… • Depends on accumulation rate… • Fast accumulation and the bubbles get sealed off in a few 10s of years • Slow accumulation and it could take 100’s of years • This has been checked with CFC’s and radioactives
Muir Glacier 1941 Muir Glacier 2004
What do the bubbles tell us? • CO2 and CH4 march in lock step with ice volume. • During glacial max atmospheric CO2 dropped to <200 ppm (it is now about 390) • That removes about 180 billion tons from the atmosphere…. Where did it go?
Where did it go….? • Vegetation? During glaciation we had less veg • Shallow Ocean? The shallow ocean actually lost CO2 • Deep Ocean….turns out there is a lot of evidence for this
The Carbon Pump • Critters in the surface waters take CO2 and make organic material thru photosynthesis • As they die, the organic tissue sinks to the deep ocean • As long as there have nutrients…..they breed
So what happens….? What is needed is a mechanism to crank up ocean productivity Remember, things are much dryer and dustier during glacial times The dust provides iron fertilizer from glacial margins and simulates critters growth…..
Methane Methane from the ice cores shows an interesting pattern Most methane is produced by decaying plant matter in wetlands (swamp gas) Produced when oxygen is absent Methane follows the insolation cycle very closely
Methane What this is tracking is the monsoon cycle The idea is that higher summer insolation cranks up the monsoons Stronger monsoons create more wetlands, which make more methane
What happens is … • There is a relationship between ice volume, insolation, and greenhouse gases
The 100K cycle We have been seeing steady climate cooling for millions of years as continents moved north and more CO2 has been lost from the atmosphere The gradual cooling eventually got to the point that the weakened insolation maxima was not able to melt all the northern ice (like now)
The 100K cycle Now only the strongest insolation peaks result in deglaciation The threshold for deglaciation seems to be rising The exact cause of the 100K is probably the feedback of reduced CO2, combined with the general cooling of continental movement
The 100K cycle What is happening is that the insolation cycles are now mostly too weak to melt all the ice that grows during the 41K cycles. The last three 41K cycles combined to produce steadily increasing ice volumes since the subsequent insolation max (until the one we are in) were too weak to do significant melting. It was only when we had a strong insolation max and a strong increase in CO2 and methane that we got rapid deglaciation