Download
1 / 1
10 likes | 152 Vues
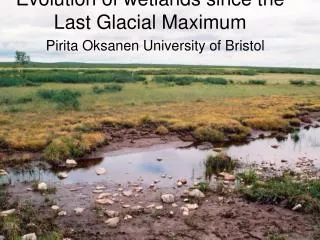
Timing of high latitude peatland initiation since the Last Glacial Maximum. Pirita Oksanen, University of Bristol, School of Geographical Sciences . Introduction

E N D
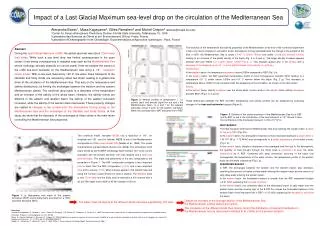
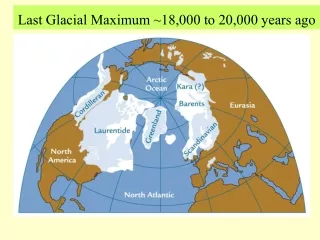
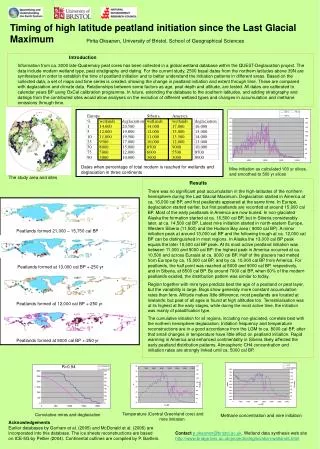
Timing of high latitude peatland initiation since the Last Glacial Maximum Pirita Oksanen, University of Bristol, School of Geographical Sciences Introduction Information from ca. 3000 late-Quaternary peat cores has been collected in a global wetland database within the QUEST-Deglaciation project. The data include modern wetland type, peat stratigraphy and dating. For the current study, 2500 basal dates from the northern latitudes above 39N are synthesised in order to establish the time of peatland initiation and to better understand the initiation patterns in different areas. Based on the collected data, a set of maps and time series is created, showing the change in peatland initiation and extent through time. These are compared with deglaciation and climate data. Relationships between some factors as age, peat depth and altitude, are tested. All dates are calibrated to calendar years BP using OxCal calibration programme. In future, extending the database to the southern latitudes, and adding stratigraphy and datings from the contributed sites would allow analyses on the evolution of different wetland types and changes in accumulation and methane emissions through time. Dates when percentage of total modern is reached for wetlands and deglaciation in three continents Mire initiation as calculated 100 yr slices, and smoothed to 500 yr slices The study area and sites Results There was no significant peat accumulation in the high-latitudes of the northern hemisphere during the Last Glacial Maximum. Deglaciation started in America at ca. 16,000 cal BP, and first peatlands appeared at the same time. In Europe, deglaciation started earlier, but first peatlands are recorded at around 15,000 cal BP. Most of the early peatlands in America are now buried. In non-glaciated Alaska the formation started at ca. 16,500 cal BP, but in Siberia considerably later, at ca. 14,500 cal BP. Latest mire initiation started in north-eastern Europe, Western Siberia (11,500) and the Hudson Bay area ( 9000 cal BP). A minor initiation peak at around 13,000 cal BP and the following trough at ca. 12,000 cal BP can be distinguished in most regions. In Alaska the 13,000 cal BP peak equals the later 10,500 cal BP peak. At its most active peatland initiation was between 11,000 and 9000 cal BP: the highest peak in America occurred at ca. 10,500 and across Eurasia at ca. 9000 cal BP. Half of the glaciers had melted from Europe by ca. 15,000 cal BP, and by ca. 10,000 cal BP from America. For peatlands, the half point was reached at 8000 and 9000 cal BP, respectively, and in Siberia, at 8500 cal BP. By around 7000 cal BP, when 60% of the modern peatlands existed, the distribution pattern was similar to today. Region together with mire type predicts best the age of a peatland or peat layer, but the variability is large. Bogs show generally more constant accumulation rates than fens. Altitude makes little difference; most peatlands are located at lowlands, but peat of all ages is found at high altitudes too. Terrestrialisation was at its highest at the early stages, while during the most active time, the initiation was mainly of paludification type. The cumulative initiation for all regions, including non-glaciated, correlate best with the northern hemisphere deglaciation. Initiation frequency and temperature reconstructions are in a good accordance from the LGM to ca. 8000 cal BP, after that small changes in temperature have little effect on peatland initiation. Rapid warming in America and enhanced continentality in Siberia likely affected the early peatland distribution patterns. Atmospheric CH4 concentration and initiation rates are strongly linked until ca. 5000 cal BP. Peatlands formed 21,000 – 15,750 cal BP Peatlands formed at 13,000 cal BP +-250 yr Peatlands formed at 12,000 cal BP +-250 yr Peatlands formed at 9000 cal BP +-250 yr R=0.94 Temperature (Central Greenland core) and mire initiation Cumulative mires and deglaciation Methane concentration and mire initiation Acknowledgements Earlier databases by Gorham et al. (2005) and McDonald et al. (2006) are incorporated into this database. The ice sheets reconstructions are based on ICE-5G by Peltier (2004). Continental outlines are compiled by P. Bartlein. Contactp.oksanen@bristol.ac.uk. Wetland data synthesis web site http://www.bridge.bris.ac.uk/projects/deglaciation/wetlands.html