Download
1 / 14
140 likes | 263 Vues
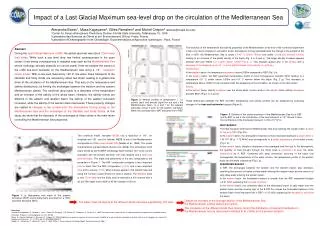
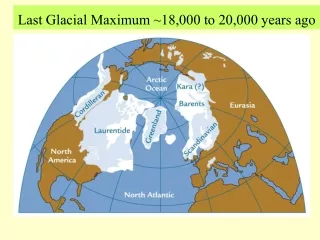
Evolution of wetlands since the Last Glacial Maximum. Pirita Oksanen University of Bristol. Wetland synthesis - distribution, extent, type and accumulation Public database Maps Data – model comparisons Since ca. 21 000 BP Phase 1. Northern extratropics. Phase 2. Tropics.

E N D
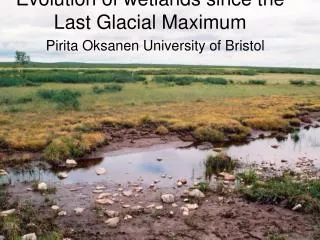
Evolution of wetlands since the Last Glacial Maximum Pirita Oksanen University of Bristol
Wetland synthesis - distribution, extent, type and accumulation • Public database • Maps • Data – model comparisons • Since ca. 21 000 BP • Phase 1. Northern extratropics. • Phase 2. Tropics.
Peatlands net sink of CO2 – vegetation sequesters from the atmosphere • Wetlands net source of CH4 – methanogenesis in waterlogged environment • ca. 5 million km2 natural wetlands • over 1 million km2 irrigated cultivation • 400-500 Gt C in peat • 100-150 Tg CH4/a from natural wetlands • ca. 40 Tg CH4/a from rice paddies • estimates for the LGM 80-110 Tg CH4/a
temperature, water table and vegetation control CH4 production and flux • wide variation of CH4 fluxes both between and within wetlands and seasons Mean values (Aselmann & Crutzen -89) • Bogs – 15 (1-50) CH4/m2/day • Fens – 80 (28-216) • Swamps – 84 (57-112) • Marshes – 253 (137-399) • Floodplains – 100 (50-200) • Lakes – 43 (17-89) • Rice paddies – 310 (179-438)
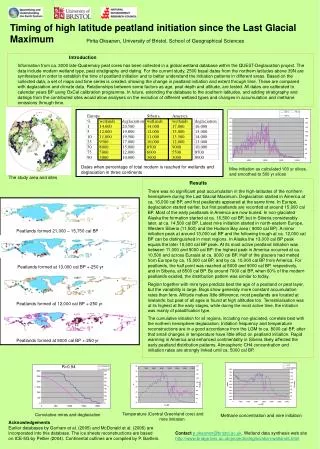
Mires today, sites with bottom dates Previous databases used: Oksanen 2005, Gorham et al. 2005, McDonald et al. 2006, PAIN. Lappalainen et al. 1996
Basal peat dates 50 000 – 21 000 BP Continental and ice-sheet outlines by Patrick Bartlein, University of Oregon
Mires at 13000 BP Experimental ice-sheet data by W.R Peltier, University of Toronto
Mires at 6000 BP, sites with basal peat dates Continental and ice-sheet outlines by Patrick Bartlein, University of Oregon
Mire initiation in arctic/boreal regions 0 2000 5000 8000 11000 15000 >21000