Download
1 / 18
180 likes | 288 Vues
A GCM Reconstruction of the Last Glacial Inception. Megan Essig 1 , Francis Otieno 2 , Robert Oglesby 1 , David Bromwich 2 1 Department of Geosciences, University of Nebraska, Lincoln 2 Polar Meteorology Group, Byrd Polar Research Center, Ohio State University

E N D
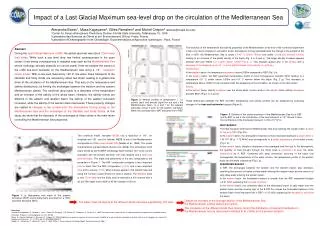
A GCM Reconstruction of the Last Glacial Inception Megan Essig1, Francis Otieno2, Robert Oglesby1, David Bromwich2 1Department of Geosciences, University of Nebraska, Lincoln 2PolarMeteorology Group, Byrd Polar Research Center, Ohio State University Presented at CCSM Workshop, Tuesday, June 17th2008
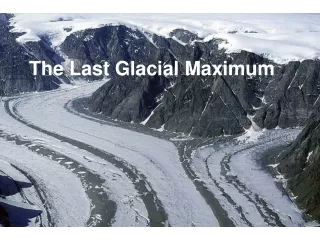
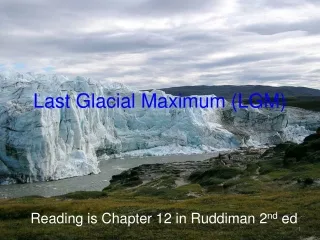
Glacial Inception Glacial Inception requires conditions that act to produce a perennial snowfield which continues to grow and ultimately results in large glaciers and ice sheets. The last glacial inception (LGI) took place around 115.5 ka. At this time there was a shift from a warm climate similar to present to a cooler one, at least in the northern hemisphere. The primary goal of the modeling work is to see if we can simulate perennial snow fields, and if so, under what conditions. The simulation is being evaluated with all available (though scarce) geologic data.
Simulating the LGI LGI thought to have been caused by a number of factors. Two of the most important: reductions in atmospheric CO2 and CH4, and changes in the earth's eccentricity, precession, and obliquity due to Milankovitch orbital cycles. We hypothesize these climatic forcings lead to a succession of cool summers and warm wet winters in key regions of the high latitude Northern Hemisphere. This should be conducive to building the perennial snow pack that is an essential precursor to the Laurentide and Fenno-Scandinavian ice sheets. We used the fully-coupled NCAR CCSM3 GCM to simulate the climate at 115.5 ka B.P.
Methodology • Use CCSM3.0 in fully coupled mode, with all components active. • Two 115.5 ka runs made • Both had eccentricity, precession, and obliquity set to 115.5 ka • GLI-180: CO2 180 ppm; CH4 at present-day values • GLI-250: CO2 250 ppm; CH4 500 ppb • Run the model to an equilibrium state, at least for the atmosphere and land surface (which occurred in about 50 years). • Results for 115.5 ka compared to NCAR’s preindustrial simulation (PI) circa 1870 with 289 ppm CO2 and present-day methane: ‘PI-289’
(Months) Globally averaged surface temperature for the PI-289, GLI-180, and GLI-250. Time steps are in months (I.e., the first 45 years of each run are shown.
Left GLI-250 minus PI-289; Right GLI-180 minus PI-289. Top: JJA; Bottom DJF. Note Northern Hemisphere cooling and Southern Hemisphere warming. Spatial extent of Northern Hemisphere cooling greater in summer than winter.
Actual JJA surface temperatures at 115.5 ka; note below freezing conditions over higher latitudes
Left GLI-250 minus PI-289; Right GLI-180 minus PI-289. Top: JJA; Bottom DJF.
August sea ice for GLI-180 (115.5 ka) August sea ice for PI-289 (1870)
Initial Results: 1. Equilibrium state for global atmospheric temperatures reached within several decades 2. 115.5 ka temperatures in the Northern Hemisphere cooler than pre-industrial values (Fig. 3 and 4) 3. Southward shift in ITCZ 4. Perennial snowfield occurs in regions where ice sheets thought to have originated 5. Increased extent of sea ice in the Northern Hemisphere but slight decrease in the Southern Hemisphere 6. Interesting interplay between CO2and orbital forcing
GEOLOGIC DATA • Geologic data very sparse for 115.5 ka, especially for terrestrial records • Fair amount of data obtained from deep sea cores • Greenland ice cores problematic, as 115.5 ka close to bottom of useable record due to basal disturbances of the ice sheets • Antarctic cores more useful, but time resolution coarser • Time of rapid climate change so data for any time period between 110 ka and 120 ka potentially useful • IF YOU KNOW OF ANY GOOD DATA PLEASE LET US KNOW!!
CO2 vs. Orbital Forcing • CO2 forcing is homogeneous in time and space • Orbital forcing varies in both time and space • Both tend to work together in the northern hemisphere summer (enhancing the cool conditions that help preserve snow); tend to cancel in mid-latitudes during winter • They strongly oppose each other in the southern hemisphere summer (e.g., sea ice actually decreases at 115.5 ka relative to the PI! As seen in the GLI-180 simulation) • They largely cancel each other in the low latitudes (little change in 115.5 ka relative to PI)
SUMMARY • Successful simulation of glacial inception, at least for Laurentide Ice Sheet • Fenno-Scandinavian ice sheet inception less well-simulated; Alaskan ice controversial - did it occur? Evidence not clear… • Northern high latitudes strongly cool; Southern high latitudes warm; temperature changes elsewhere more modest • Sea ice increases strongly in northern hemisphere; slight decrease in southern hemisphere • ITCZ shifts southward, especially in NH summer • Fascinating interplay between CO2 and orbital forcing
The geologic records that have been recorded show encouraging similarities to the model results. • In Greenland the ice core shows cooling similar to what the model predicts. • In Antarctica the geologic data from EPICA shows little change in the temperature which is predicted by the model, while in 2 other ice cores the geologic data shows cooling around 3° C which is observed in the winter months in Antarctica. • The deep marine cores from this time period shows that there is a slight warming in the mid-latitudes in the Southern Hemisphere, which is seen in the model results. • We conclude that the model did an adequate job simulating the climate of the LGI. • Next step: Systematic sensitivity runs with just greenhouse gases and with just orbital forcing to help tease out the differing effects